


In this article, we present performance results of a long/short equity trading strategy in weekly timeframe.
Article updated on 07/10/2020
Long/short equity strategies involve taking both long and short positions so that a net profit is made while market exposure is minimized. Usually during bull markets long positions tend to be more profitable than short and the other way around during bear markets. Therefore, the profitability of a long/short strategy does not depend on market direction.
There are many ways of developing and executing these type of strategies. In this article we look at a strategy in the weekly timeframe based on factors (also known as features, predictors or attributes) engineered by DLPAL LS:
DLPAL LS uses primitive attributes of price action, and specifically the open, high, low and close, to extract features types in an unsupervised learning mode based on general feature clusters. Then, the program uses the extracted features in supervised learning mode to identify long and short candidates in a universe of securities. The long/short identification is based on a set of calculated features and the user has flexibility in ranking the results according to their values… Historical files of features can be generated for backtesting the strategies and for machine learning.
The strategy described below is applied to Dow 30 stocks but any other group can be used.
Strategy specifications
Note: In this strategy up to six positions are open at all times. This strategy is employed in Premium Market Signals.
Time-frame: Weekly
Strategy type: Long/short equity
Universe: Dow 30 stocks (DOW not included and BA not included after 06/12/2020)
Backtest period: 01/04/2016 – 07/20/2020
Reserved for weekly feature calculation: 01/03/2000 – 12/31/2015
Open positions: Maximum 3 long and 3 short
Position size per stock: Equity/6
Position entry/exit: Open of next weekly bar
Commission per share: $0.005
Strategy logic
Score: P-delta × S

Buy the top 3 and short bottom 3 based on score at the open of next week
Strategy performance (01/04/2016 – 07/10/2020)
| Parameter | Strategy |
| CAGR | 6.8% |
| Max. DD | -5.4% |
| Sharpe | 0.4 |
| MAR | 1.26 |
Below are the equity curve, underwater equity curve and monthly returns table. (Click on image to enlarge.)

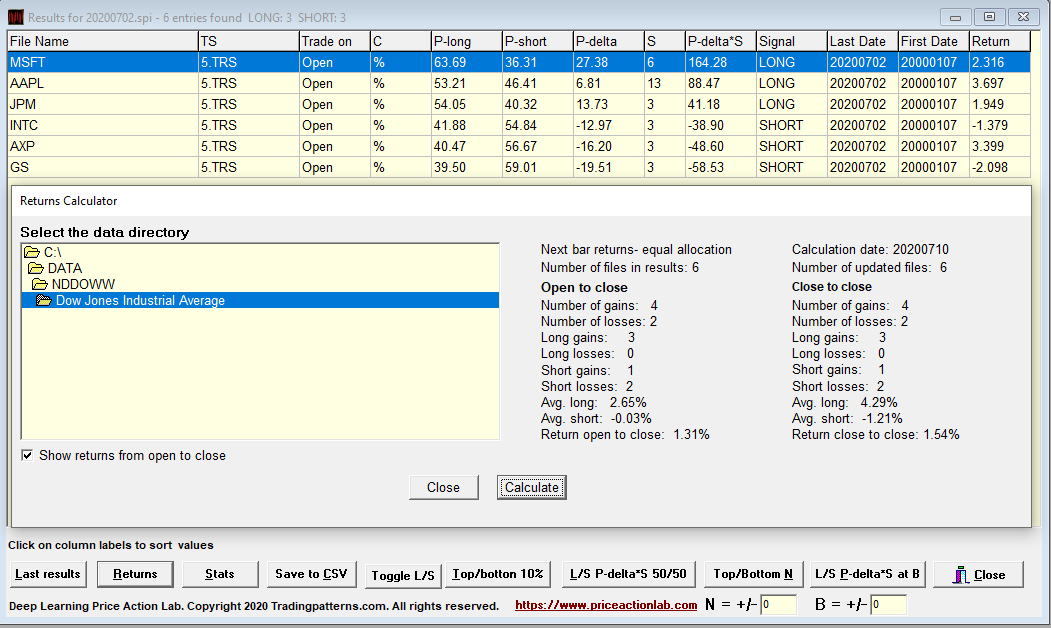
Weekly Execution
Weekly execution involves updating weekly data files, ranking stocks according to score and then clicking L/S Pdelta*S at N after specifying N equal to 3. An example of results generated for week July 6, 2020, is shown below with returns calculations for the following week ending July 10, 2020.
More details about DLPAL LS can be found here. For more articles about DLPAL LS click here.
If you have any questions or comments, happy to connect on Twitter: @priceactionlab
Hedge funds can receive a free fully functional demo of DLPAL LS valid for one month. For more details and information on how to order a demo click here.
Please read our Disclaimer and Terms and Conditions before ordering a demo or full version of DLPAL LS.


