


The main idea behind this ETF strategy is taking advantage of relative momentum as measured by four ETF ratios. Our analysis and conclusions below.
One of our premium subscribers emailed us a link to an interesting article by Greg Morris in StockCharts website (see reference at the end.) We thought this is an interesting idea and since the performance of the strategy was analyzed until the end of 2012 we decided to program it to get more recent performance results.
Strategy details
1 Four ETF ratios are constructed: MDY/IEI, IJR/IEF, QQQ/MBB and GLD/TLT
2. Positions resulting from each pair are allocated 25% of available equity
3. Trigger is ±4% in the one-period ROC of the 2-period smoothed ratio
4. If trigger > +4% we go flat and then long the ETF in the numerator of the ratio
5. If trigger < -4% we go flat and then long the ETF in the denominator of the ratio
6. Timeframe is weekly. We use $0.01 share in all backtests.
Backtest results: 01/2003 – 12/2012
Greg Morris extended backtests results back to 1998 probably by using the underline indexes but here we start in 2003 just to check our code basically. Below is the equity curve and monthly results table. Click on images to enlarge.
 | 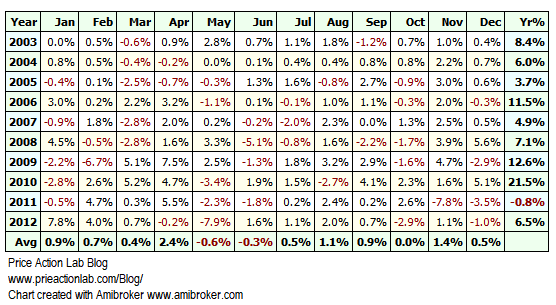 |
Below is a table that compares the strategy performance to SPY total return in this period of the backtest.
| Parameter | Strategy | SPY Total Return |
| CAGR | 9.1% | 6.5% |
| Maximum Drawdown | -10.1% | -55.2% |
| Sharpe | 1.33 | 0.51 |
| MAR | 0.93 | 0.12 |
| % Winners | 61.2% | – |
The strategy outperforms the benchmark on both absolute and risk-adjusted returns basis. MAR (CAGR/Max. DD) for the strategy is 0.93 versus just 0.12 for buy and hold of benchmark.
When you see such great outperformance, the first task should be to try to determine if something could be wrong, as I argue in my book Fooled By Technical Analysis. Focusing on just the positive aspects can often divert attention from hidden issues, such as data-snooping for example.
We basically want to know is this is a random strategy or a sound hypothesis. Random strategies are often the result of data-mining, data-snooping and selection bias (all discussed in the mentioned book in detail.) But good and sound strategies can also fail because market conditions change. See my paper for an example.
The first indication that something went wrong (random strategy or change in market dynamics) is the equity whipsaw after 2010. Then, the bulk of the gains came in the period 2009 – 2010. While those do not offer conclusive evidence against the strategy, we will proceed with a forward test since this is possible because we have the data.
Backtest results: 01/2013- 02/2019
Below is the equity curve and monthly results table. Click on images to enlarge.
 | 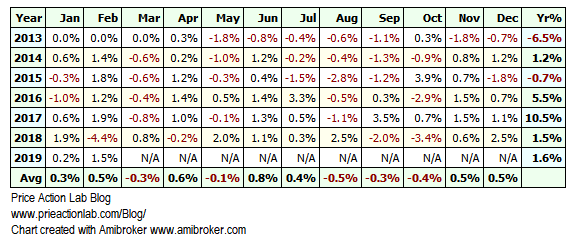 |
Below is a table that compares the strategy performance to SPY total return in this period of the backtest.
| Parameter | Strategy | SPY Total Return |
| CAGR | 2.1% | 13% |
| Maximum Drawdown | -9.2% | -20% |
| Sharpe | 0.39 | 1.00 |
| MAR | 0.23 | 0.67 |
| % Winners | 49.3% | – |
The strategy significantly underperforms the benchmark on absolute returns basis but also on risk-adjusted returns basis even though it has a little less than half the drawdown. MAR (CAGR/Max. DD) for the strategy is 0.23 versus 0.67 for buy and hold of benchmark.
However, the strategy does not exhibit any large losses and performance last year was positive at +1.5%. Something went wrong in forward sample but we are not going to declare it a random strategy at this point. There may be room for some improvement although due to the large number of variables there is also risk of over-fitting.
This strategy appears to deliver low drawdown consistently but alpha delivery has been hindered recently. This may be the result of a crowded ETF space along with crowding in relative and absolute momentum strategies using ETFs. As the number of players decreases due to attrition this strategy may start performing better but it is impossible to say when. A lot of additional work and analysis are required by those who are interested in such strategy to determine proper allocation and risk.
Reference 1: Core Rotation Strategy
If you found this article interesting, I invite you follow this blog via any of these methods below:
RSS or Email, or follow us on Twitter
If you have any questions or comments, happy to connect on Twitter: @mikeharrisNY
Market signals from systematic strategies are offered in our premium Market Signals service. For all subscription options click here.


