


Look-ahead bias in backtests usually involves counting returns before the entry signal and in some cases also omitting returns due to the exit signal. In essence, this amounts to a backward shift of returns and it is mostly due to coding errors. In this article, I provide an example of look-ahead bias and suggest practical ways of detecting it.
After a recent paper that claims there is look-ahead bias in some peer-reviewed publications, it is time for the financial community to show responsibility and take a serious look at this problem.
We will look in this article at the 10-month moving average applied to S&P 500 monthly data (no dividends.) No commissions and no slippage are included because the objective is to demonstrate look-ahead bias.
No look-ahead bias: S&P 500 monthly data: 01/1960 – 12/2015. We buy at the close if the price crosses above the 10-month moving average and sell when the opposite occurs. Below are the equity curve and statistics:

CAR is 7.38% and Sharpe is 0.53. This is about what experienced trading strategy developers should expect from this simplistic system.
Look-ahead bias: This is manifested by a backward shift of monthly returns after a signal is generated. It is simulated by initiating and exiting positions at the previous close after a signal is generated. This is the equity curve and statistics:
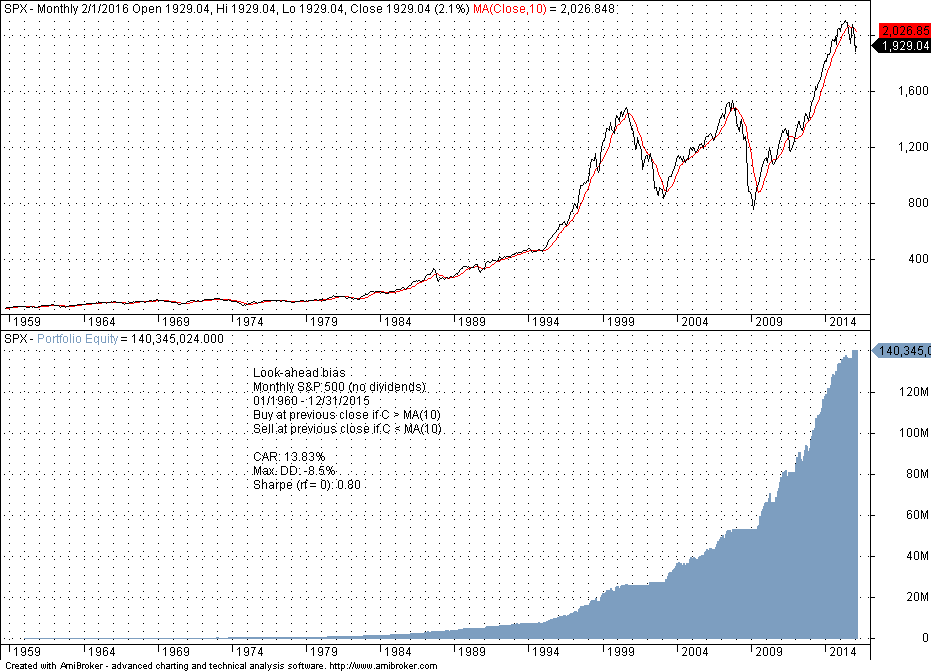
The equity grows almost exponentially and it is a lot smoother. CAR is 13.8% and Sharpe increases to 0.80. Experienced strategy developers know that smooth equity is too good to be true. However, most academic papers do not include equity curves but only statistics and it is hard to catch any error. Also, traders know that CAR above 10% is usually either due to a curve-fitted system or some type of error in the code.
Therefore, the practical test of look-ahead bias is to look at the equity curve. If it looks smooth and exponential, then one is dealing with a Holy Grail strategy or look-ahead bias in code. When using languages designed for statistical analysis to backtest strategies, such as R for example, coding errors are more frequent because everything must be done at a much lower level than when using commercial backtesting platforms. However, even in the latter case, look-ahead bias is possible if a trader is not careful.
In finance, if something looks too good to be true, then it is suspicious. Annual returns above 12% usually point to curve-fitted results or coding errors. The time has come for the finance community to take a serious look. It appears that although practitioners of trading strategy development have already solved these problems to a large degree, the academic community is still at a primitive stage. There should be no tolerance for look-ahead bias and anyone who submits a paper to a peer-review journal should also submit the data and code so that claims can be scrutinized by other researchers.
Disclaimer: No part of the analysis in this blog constitutes a trade recommendation. The past performance of any trading system or methodology is not necessarily indicative of future results. Read the full disclaimer here.
Charting and backtesting program: Amibroker. Data provider: Norgate Data
If you found this article interesting, you may follow this blog via RSS or Email, or on Twitter


