


In this article we show how to prepare historical files with continues features and a discrete target using DLPAL PRO. Then, we apply a binary logistic regression classifier on a random sample of half of the data and test the results on the remaining half. Finally, we test the classifier performance out-of-sample. The results are promising since the quality of the generated features is high to start with.
Data generation and preparation
The first and most crucial step is to generate a data file with rows (instances) and a discrete target to use with a classifier. We select SPY ETF and we create a file with 1500 instances (rows) of features using DLPAL PRO’s P-Indicator history tool, as shown below:
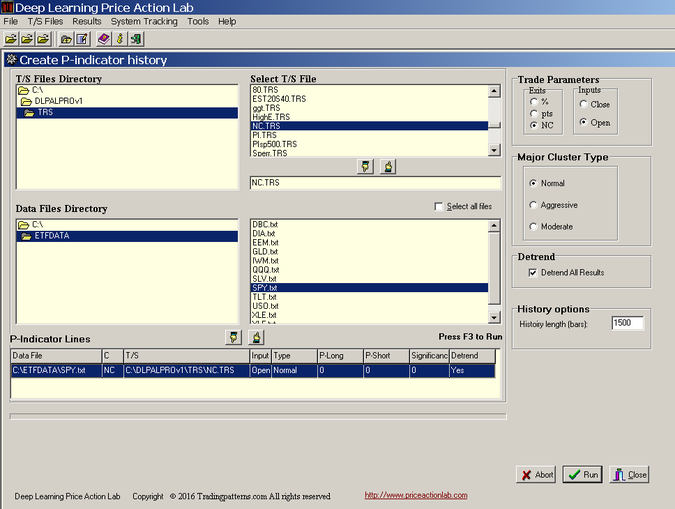
Note that we selected the Next Close exit (NC) option because we are interested in returns from the open to the close of a bar since trades can only be executed at the open. We also selected the Normal cluster and the detrend option since we are interested in short-term trading and we want to remove longer-term bias.
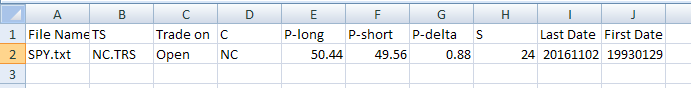
It took less than an hour for DLPAL PRO to generate the data file. Then, we imported the file in excel, we calculated our target and added labels for the features and target class. Below is a screenshot of the file:
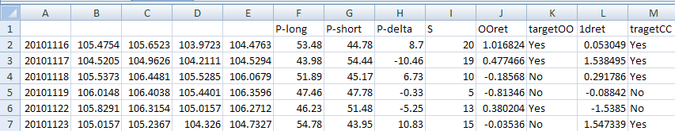
The train and test period are from 11/16/2010 to 12/31/2015. The out-of-sample is from 01/04/2016 to 11/01/2016. There are four features: P-long, P-short, P-delta and S. The P-delta is the difference P-long – P-short. For this particular example we will use the first three features and targetOO, which is the first difference of the open of two days forward and the open of the next day. TargetCC is the first difference of the close of next day and close of today and it is included here just to make the point that the bulk of machine learning publications that are based on next day’s returns are not realistic. This is because the close is needed for the score before a trade is entered and using it in tests may result in look-ahead bias. Therefore, we use the practical targetOO because trades are entered at the open of the next bar and exited at some future open price. We “target” a realistic return rather than an unrealistic one.
Training and testing
We apply random sampling of instances (data file rows) with a 50% proportion size to generate training and test samples. We first use a Support Vector Machines classifier with RBF Kernel to get an idea of the error rate in the test sample. This turns out to be 0.4682, which is satisfactory for financial data. We then apply a Binary Logistic Regression (BLR) classifier. The error in the test sample is 0.4667. Analysis has shown that if the quality of the features is high, the simpler LBR suffices to do the job. On the other hand, if one must try hard with feature engineering to get a low error rate, then risk of over-fitting is high.
We then implement the logistic function in Amibroker with the coefficients calculated from the training sample. Normally, retraining should take place frequently or even daily and only data from the last bar are scored but in this example we elect to see how robust are the logistic function’s predictions year-to-date.
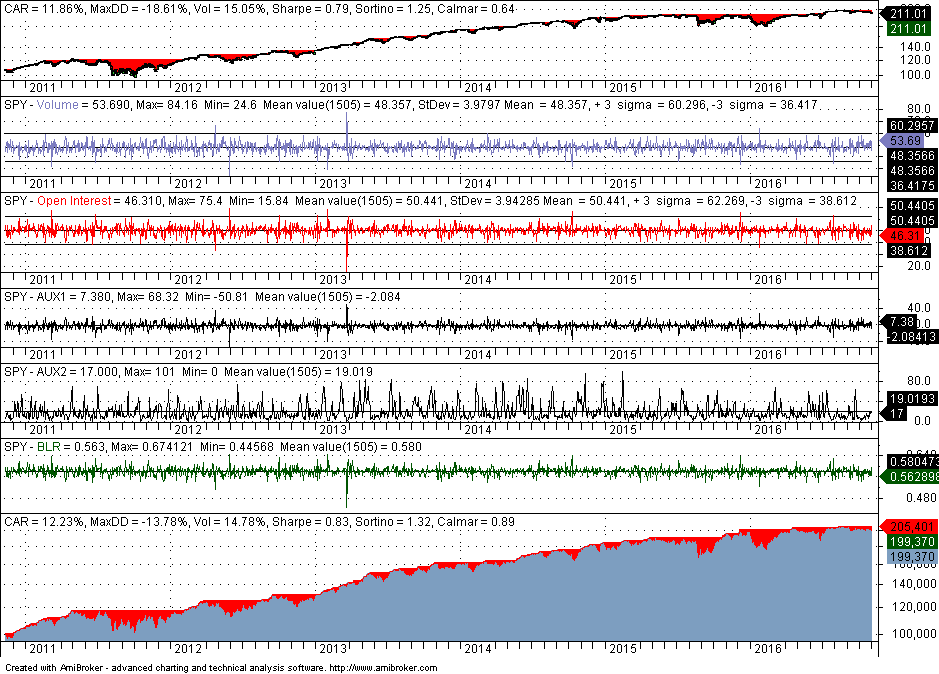
The top chart shows performance of SPY for the whole sample, the values of the features are shown in the next four panes, the logistic function BLR and the equity curve are shown in the bottom two panes. Outperformance in part of the in-sample should be expected and it is the case in this analysis. Annualized return (CAR) is higher by about 40 basis points and maximum drawdown is lower by a respectable +5%. Note that the backtest included commission of $0.01 per share and equity is fully invested.
We are interested in out-of-sample performance shown below:
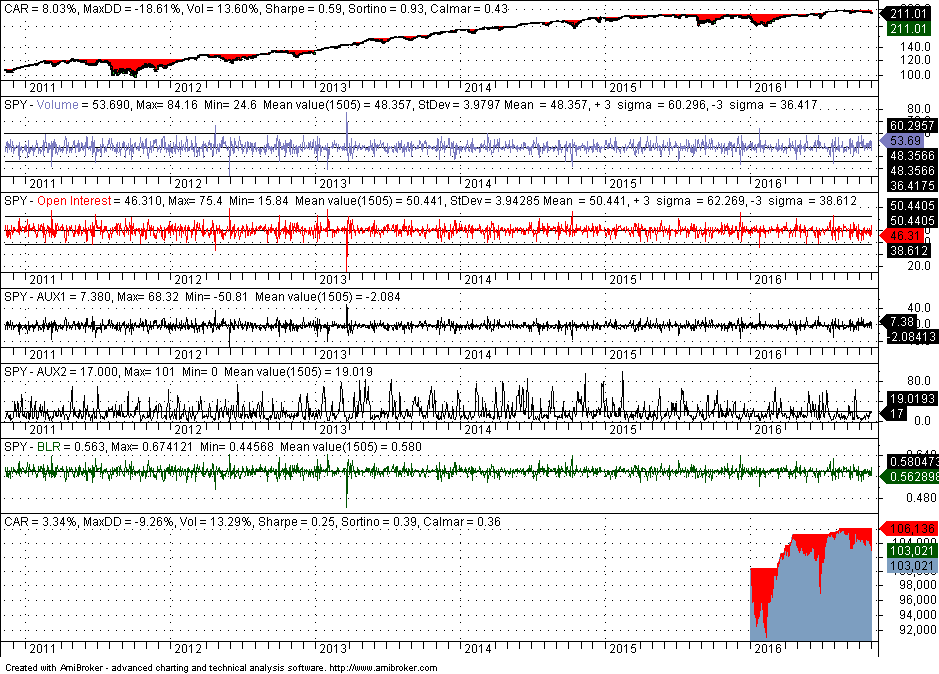 Performance is not bad given that there is no retraining after the end of test sample. With some extra feature engineering and tweaking of parameters, performance may increase significantly. But this is not the objective on this article.
Below is a list of questions and answers.
Q1: What is the exact form of the logistic function used in the backtests?
Ans1: The exact form will only have value for those who will go over the exercise themselves. The objective of this article is not to provide a strategy but to evaluate the potential of feature construction and machine learning process.
Q2: Is the train-test part of analysis required? Are there any alternatives?
Ans2: No, it is not required and in some cases it can be detrimental. Using the combined train+test sample the error rate of BLR is 0.4407. Analysis based on bootstrap yields an average error of 0.4531, even better than the error from the test set. Backtests also confirm that out-of-sample performance using the whole price history to train the classifier is similar to that obtained from the train/test sample.
Q3: How are the features constructed by DLPAL PRO p-indicator history?
Ans3: More information about the features can be found here. More information about DLPAL PRO can be found here.
Q4: How to generate new data and get a score?
Ans4: The easiest way with v1.0 of DLPAL PRO is to use the original p-indicator function for SPY and NC TRS file, for normal cluster and detrernd. Then the result can be saved in a .CSV file, as shown below:
This file can be used to get the score. In this particular case it is 0.575, which means that an up day is predicted for Thursday, November 3, 2016.
One could also generate a file with p-indicator history length of 1 and then prepare the file for scoring by adding the labels of the features.
Q5: Is this the way to develop trading strategies with DLPAL PRO.
Ans5: No, this is an alternative way that the program facilitates. There is also the unsupervised/supervised method for feature creation from price action combined with strategy synthesis, called the search function. There is also a scan function for discretionary traders. Several validation tools are available, including portfolio backtests and robustness tests. More information about these two other methods is available in the basic version manual.
If you have any questions or comments, happy to connect on Twitter: @priceactionlab
You can download a demo of DLPAL from this link.


