


In this article we show one way DLPAL can be used to execute a long/short equity strategy. The features generated by the p-indicator function of the program are used to identify long and short candidates. An example is included.
Long/short equity strategies are preferred by hedge funds since their performance does not depend on an explicit forecast of market direction.
The general idea is to hold N securities long and M securities short, with M = N usually, and realize a net gain on the trade. Although this type of strategy offers maximum potential when both long and short positions profit, it is also profitable when long positions are more profitable than short, or the other way around. When the long and short amounts are equal, this strategy is usually referred to as “market neutral” but this should not be interpreted as “risk-free.” Long/short equity strategies minimize market exposure but they may fail due to flaws common to all strategies, for example over-fitting to past conditions, selection bias, data-snooping bias, etc.
Retail traders use a trivial version of long/short equity with N = M =1, known as a “pair trade.” They usually take a long position in a stock from a sector that outperforms the market and a short position in a stock from a sector that has negative performance, in equal dollar amounts. Risk is maximum when both legs of the trade turn unprofitable.
In Part One we showed how to use the search function of DLPAL to develop strategies for systematic trading. The DIAT4S3 strategy developed in 2013 generated nearly 24% net return based on evaluation in the Quantopian platform with 1-minute data.
In this particle, we show how to use the features generated by the p-indicator function of DLPAL to execute a long/short equity strategy.
For this example, we will use the S&P 100 universe of securities and a p-indicator workplace in DLPAL, as shown below.
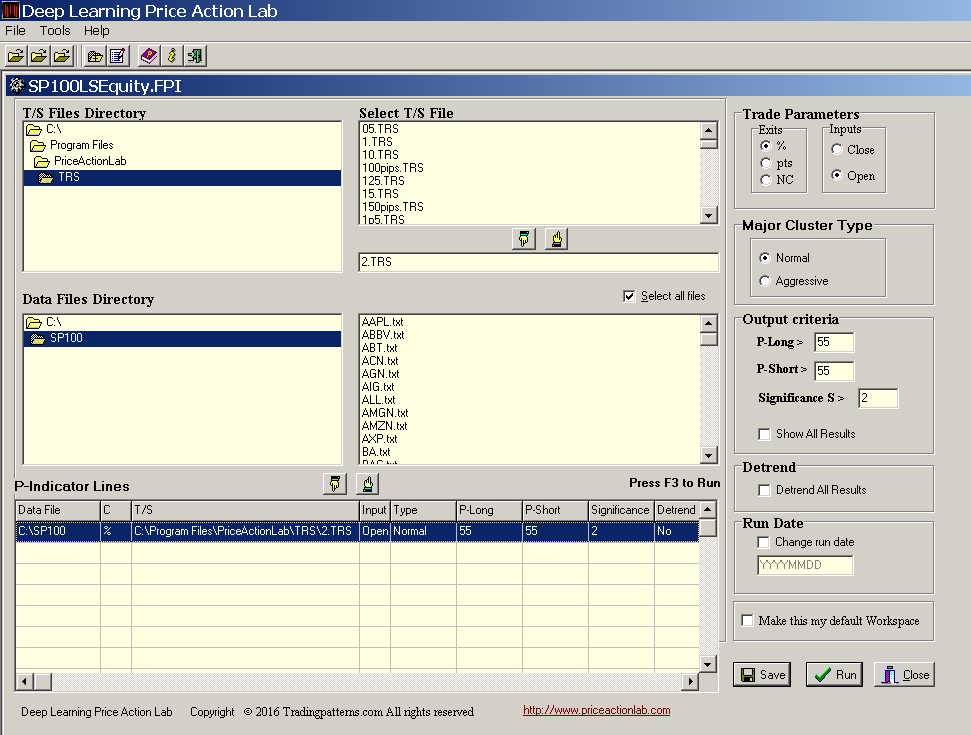
We use adjusted data for all stocks from 01/2000 because we do not want data from the unique bull market of the 1990s to bias the results. The last date is 01/11/2017. We use a small profit target and stop-loss of 2% in the calculation of the p-indicator features because we want to avoid over-fitting to the data. Other values can be tried as well. This is only one example.
We also instruct DLPAL to report results with P-long and P-short values greater than 55 and significance S greater than 2. P-long and P-short are the long and short directional bias respectively and S is the significance of the result.
Below are the results after we hit Run.

TS is the profit-target and stop-loss file, P-long and P-short are the long and short probabilities, P-delta is the difference (P-long – P-short), a measure of the directional bias and S is the significance of the result.
DLPAL identified 23 stocks that met the conditions on the workspace, 18 with positive bias and 5 with negative.
Next we save the results in .csv format to perform some features engineering. Specifically, we know that the product of P-delta and significance S provides good classification of long and short candidates.
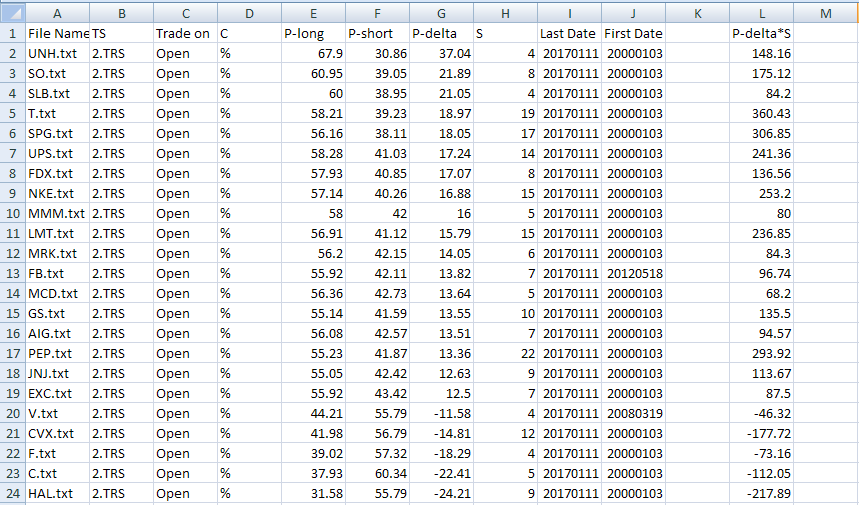
After calculating P-delta*S, we select three stocks to go long with highest positive value of the product and three stocks to go short with lowest negative value of the product. The results are summarized in the table below.
| Long | Next (close-open) | Short | Next (close-open) |
| T | +0.44 | HAL | -0.62 |
| SPG | +1.48 | CVX | -0.34 |
| PEP | +0.13 | C | -0.30 |
It may be seen that all long and short positions gained based on the open of the next day, 01/12/2017.
A better classification method
A better classification method and also feature engineering may be achieved via the use of machine learning. In this case it is necessary to generate sufficient history of the features to train a model in the in-sample and then evaluate it in the out-of-sample. Click here for an example. This is accomplished by DLPAL PRO software.
Initial generation of historical features data takes time but as soon as the files are available, updating is fast and new instances can be ranked in a matter of seconds.
In some cases manual and machine learning classification results may overlap but the latter offers more possibilities although opinions may differ.
Backtesting long/short equity strategies
Backtesting of long/short equity strategies based on p-indicator features may be performed by using the historical features data generated by DLPAL PRO.
You can download a demo of DLPAL from here. For more articles about DLPAL and DLPAL PRO click here.
If you have any questions or comments, happy to connect on Twitter: @priceactionlab


