


In this article we use DLPAL S to develop a trading strategy for TLT ETF. We also discuss two alternatives methods of validation based on out-of-sample testing and tests on comparable securities.
DLPAL S identifies parameter-less strategies in historical price data that fulfill user-defined performance statistics and risk/reward parameters. These strategies are also known as parameter-less price patterns. For more details click here.
We offer a free two-week fully-functional demo trial of DLPAL S. Demo users can fully replicate the results of this study and also develop an unlimited number of strategies for other markets and test them in one of the platforms for which DLPAL S generated code. A full license is required for updating the strategies on a regular basis, usually every three months. Click here to request a demo.
Program setup
We used unadjusted TLT daily data from 07/30/2002 (ETF inception) to 11/10/2017. The in-sample is from 07/30/2002 to 12/30/2011. The out-of-sample is from 01/03/2012 to 11/10/2017.
We will search for strategies in the in-sample that have 2% profit target and stop-loss. The workspace setup is shown below:
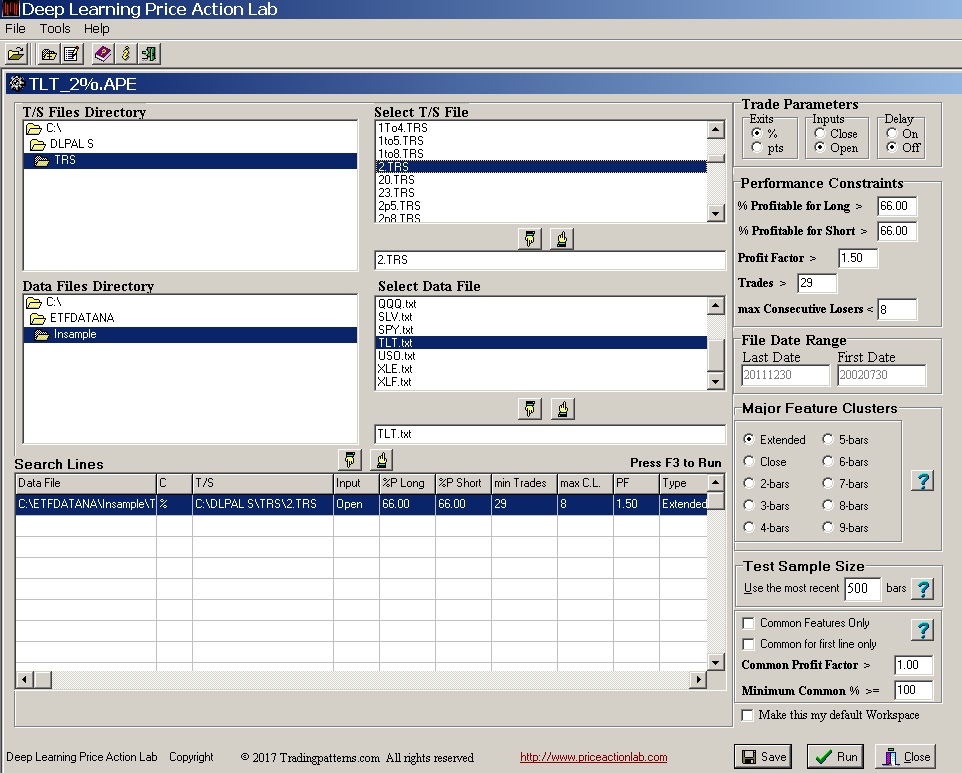
We set the minimum number of trades per strategy to 29 and leave the other settings at default values. The TLT in-sample data file is selected. The results are shown below.

Each line in the results is a strategy that satisfies the performance parameters specified on the search workspace. Index and Index Date are used internally. Trade on is the entry point, in this case the Open of next bar. P is the success rate of the strategy, PF is the profit factor, Trades is the number of historical trades, CL is the maximum number of consecutive losers, Type is LONG for long strategies and SHORT for short strategies, Target is the profit target, Stop is the stop-loss and C indicates whether % or points for the exits, in this case it is %. Last Date and First Date are the last and first date in the data file.
DLPAL S identified 58 long a two short strategies in the in-sample. The question now is how these have performed in the out-of-sample. We initially use the “Test Strategies” tool of DLPAL S to test a system that included all strategies in the out-of-sample but for more detailed results we generate code for Amibroker.
Note 1: Out system is based on ALL strategies generated by DLPAL S in the in-sample. Selecting strategies that perform best in the out-of-sample introduces data-snooping bias and the system may be random.
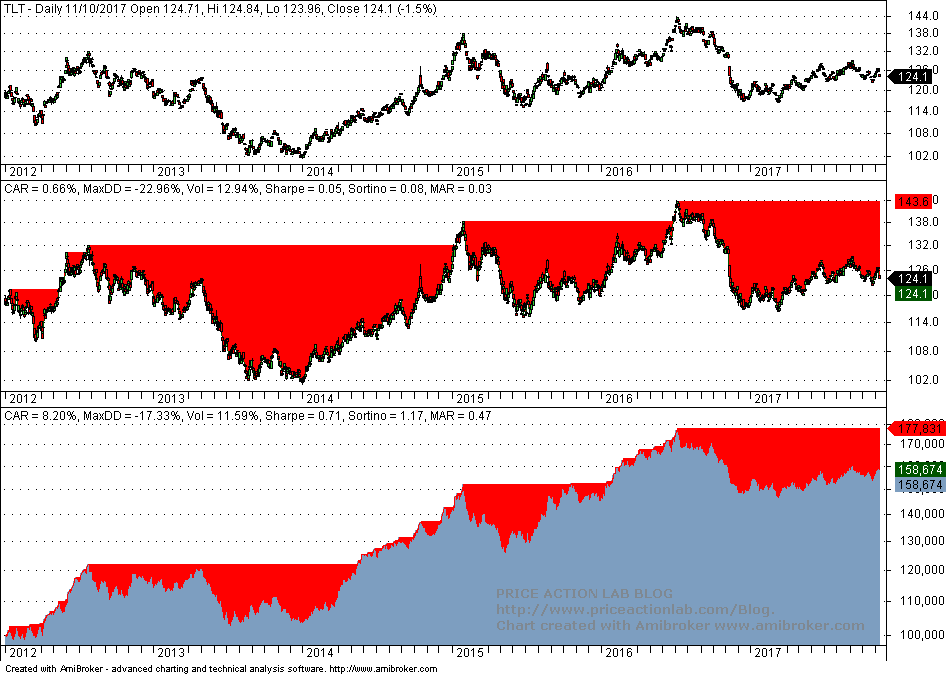
Backtesting result for in and out-of-sample)
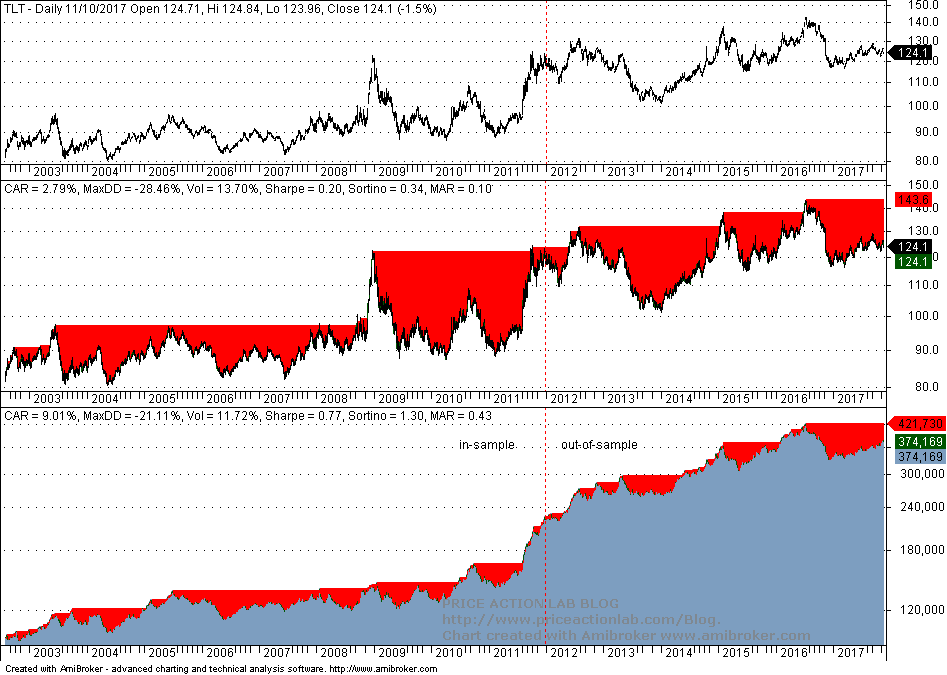
Below is a table of key performance parameter for in-sample and out-of-sample (OOS).
| Parameter | In-sample | Out-of-sample | B&H (OOS) |
| CAGR | 9% | 9.5% | 0.7% |
| Max. DD | -18% | -21% | -23% |
| Sharpe | 0.76 | 0.83 | 0.05 |
| MAR | 0.50 | 0.45 | 0.03 |
It may be seen from the above table that out-of-sample performance is better than in-sample and way better than buy and hold in out-of-sample. This is a very desirable result when developing strategies provided that there is no selection bias and all results are included in the final system.
Note 2: Selection of strategies from results can take place AFTER the initial validation test in out-of-sample is positive. For example, below is a backtest of a system of the top five strategies in the original in-sample results in terms of number of trades.
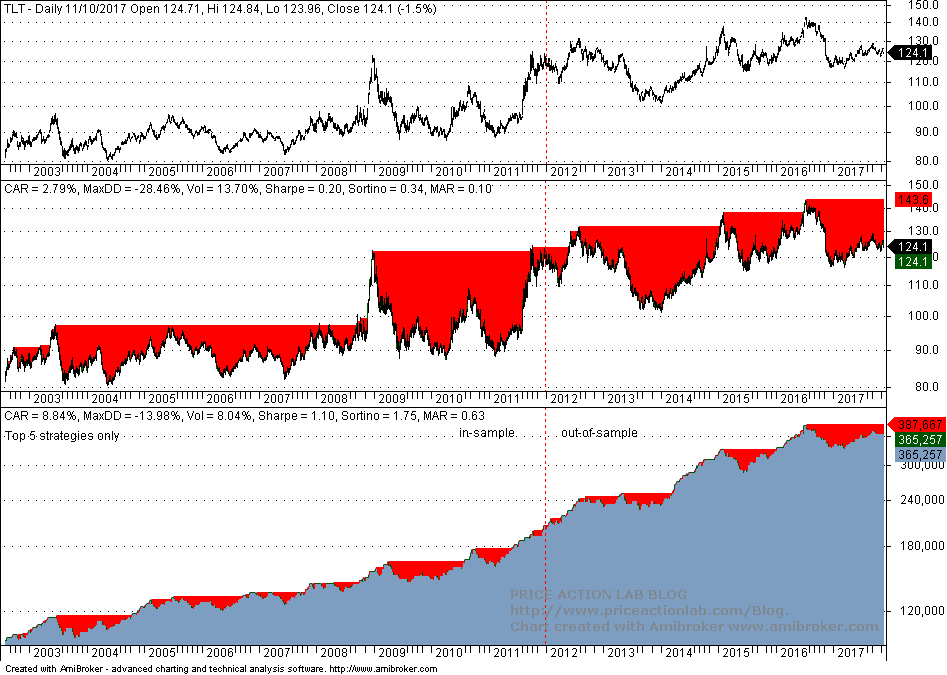
It may be seen that Sharpe and MAR increased while maximum drawdown decreased in the combined sample. However, as already noted, this type of selection makes sense after all the original results are validated. In essence, we minimize data mining bias by including in our final strategy out-of-sample tests the impact of all strategies.
Note 3: There are many ways of developing and validating strategies. Some of them are considered integral part of trading edge. Based on discussions we had with our customers we have determined that some of them use DLPAL S in some very ingenious ways we have never thought of before. We have put a lot of effort and have committed a lot of resources in developing the basic tool and we are glad people can think of ways of using it we never thought of before. Actually, this is the intimate purpose of a good tool.
Validation on a comparable security
Instead of searching for strategies in-sample and validating out-of-sample, we use the whole available history to expose the program to more market condition. We then have to validate the results. We choose SPY because it is anti-correlated with TLT and that results in a conservative validation test. Below is a correlation chart in the original out-of-sample.
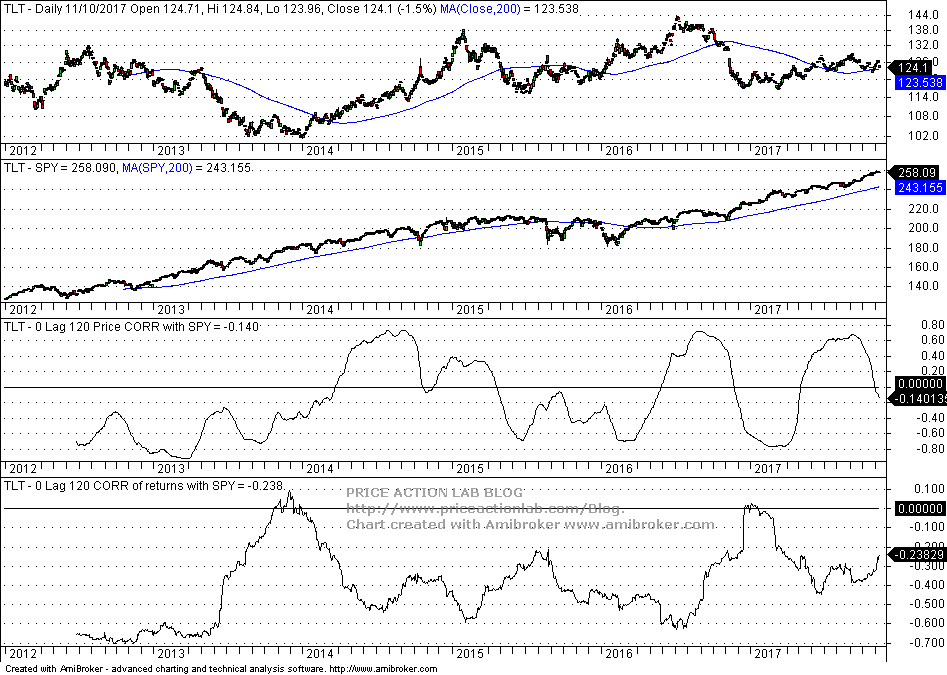
It may be seen that 120-day price correlation has full swings between positive and negative and 120-day returns correlation is negative during the whole OOS period except for a small break above zero in 2013.
We repeat the search and we get 134 long and 6 short strategies for the combined sample. Then we generate code and backtest a system that combines all TLT strategies in both TLT and SPY in the original out-of-sample period. The results are shown below. Click on images to enlarge.
 |  |
It may be seen that performance is positive in TLT as expected but it is also positive in SPY despite the anti-correlation. Now we can go ahead and select top strategies. We elect to include in a system the top 11 strategies with 60 or more trades. The results for the system as shown below for the out-of-sample:

This last strategy appears to perform better but this is not an unbiased performance although validated on a comparable security. This was the result of another choice of validation and strategy selection but the ultimate decision of what to use rests with the user of the program. As already noted there are several alternative schemes that can be used to minimize probability of random results. Although each has advantages and disadvantages, some form of validation on unseen data must be used otherwise the result can be a random fit on historical data. We prefer validation on comparable securities when possible, preferable on anti-correlated one, because this allows exposing the search to more market conditions as compared to the in-sample/out-of-sample method.
You can request a free demo of DLPAL S here. For more articles about DLPAL S click here.
If you have any questions or comments, happy to connect on Twitter: @priceactionlab
Subscribe via RSS or Email, or follow us on Twitter.
Disclaimer: No part of the analysis in this blog constitutes a trade recommendation. The past performance of any trading system or methodology is not necessarily indicative of future results. Read the full disclaimer here.


