


Selection bias is a significant component of data-mining bias and if it is not minimized it usually leads to random results. In this article we show how to use portfolio backtests to reduce selection bias when using DLPAL S to develop a trading strategy for SPY ETF in the daily timeframe.
The objective is to demonstrate how to use portfolio backtests to minimize selection bias and not to develop a final strategy because that requires more step and tests. We will use unadjusted SPY ETF data. The in-sample is from 01/29/1993 to 12/31/2010 and the out-of-sample from 01/03/2011 to 02/28/2018. All backtests include commission of $0.01 per share and equity is fully invested.
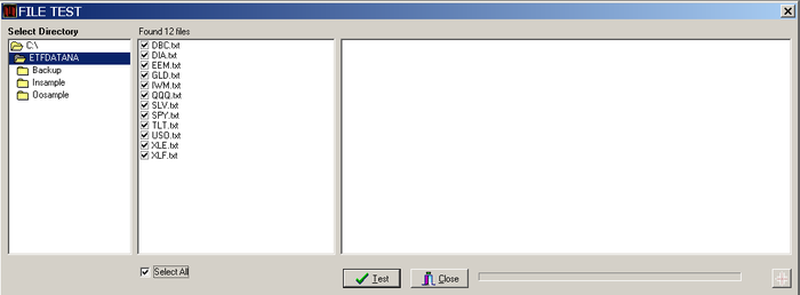
We start always by checking the data files for error. This sounds like a boring step but it is very important. You can use the File Test tool in DLPAL S to check any number of data files for errors. In this case, they were no errors so out data are good.
The next step is to partition the data in the in-sample and out-of-sample. Again, this is easily done in DLPAL S with the Data Partition tool:

We will develop a trading system for SPY ETF with 4% profit-target and 3% stop loss. The Profitability Calculator determines the approximate minimum win rate to use in the search workspace. We specify a minimum profit factor of 1 (breakeven):

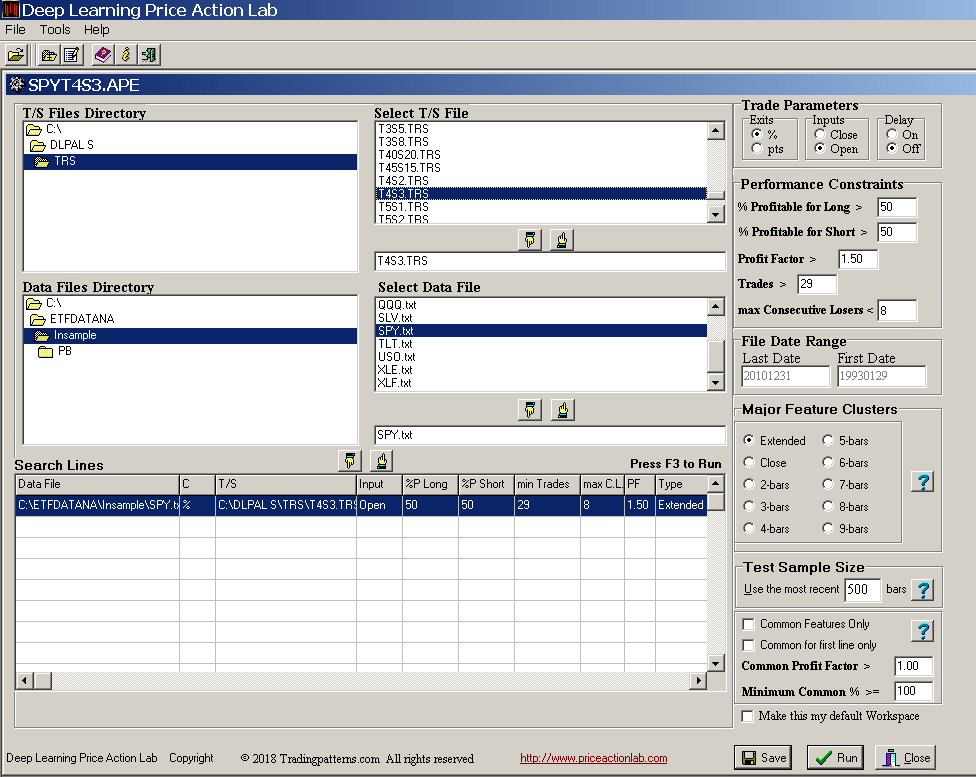
On the workspace we specify minimum profit factor of 1.5 and minimum win rate of 50%. Minimum number of trades is set at 30 ( > 29). All other parameters are set to values shown below:
Below are the results that were generated after about two hours of execution time:
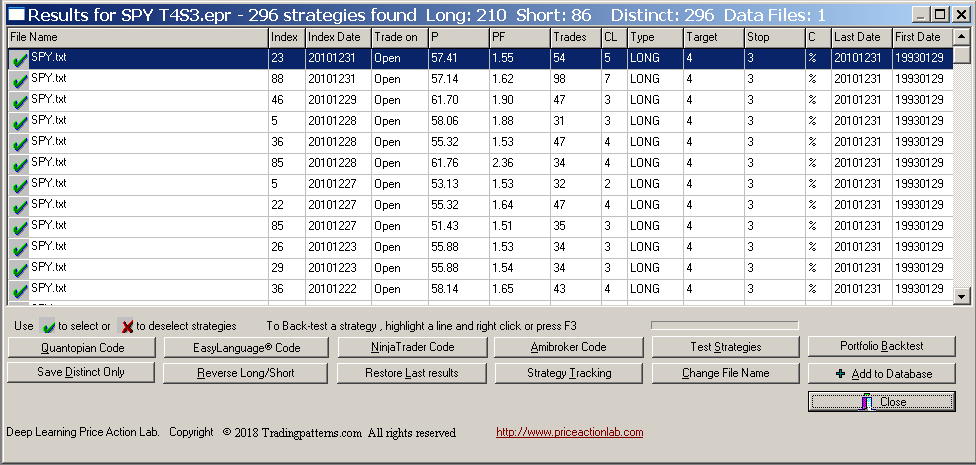
DLPAL S found 296 strategies, 210 long and 86 short, which satisfied the criteria specified on the search workspace. We will not use all those strategies to develop a system because it is not practical but just for illustration, below is the out-of-sample performance of a system that combines all 296 strategies with the Boolean OR operator after generating Amibroker code in DLPAL S and backtesting the system in that platform:
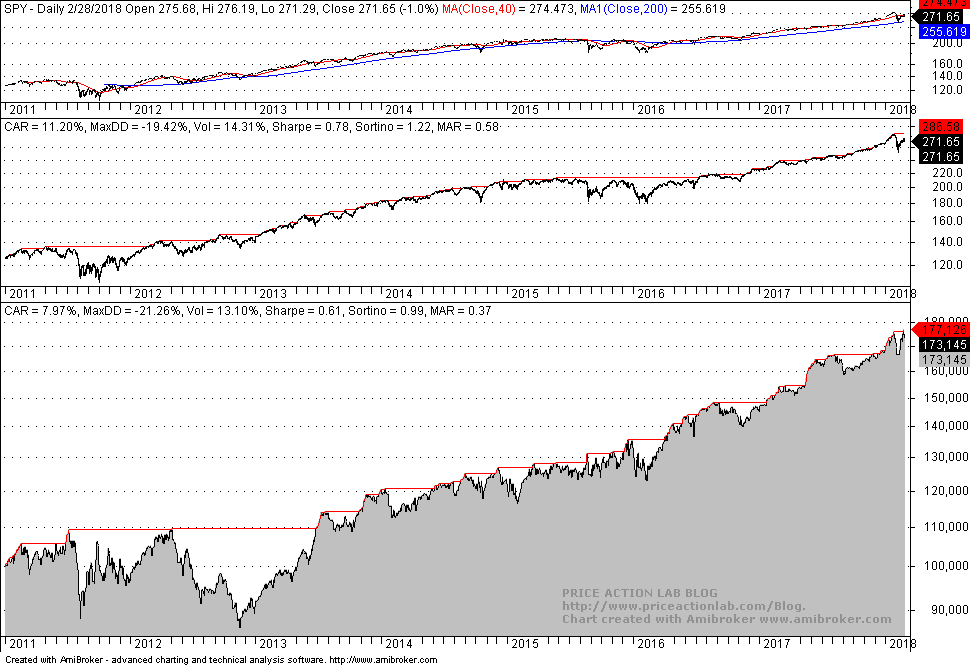
Obviously, although the performance is acceptable in the out-of-sample, it is not impressive. There is equity whipsaw in the first two years as in buy and hold. However, this strategy passes the out-of-sample test.
We would like to select a smaller set of strategies from the original set of 296 strategies but we cannot do that based on in-sample performance and off course not based on out-of-sample performance because that would cause data-snooping bias. However, this is what some users and even developers of software that data mines for strategies do. The results from this naive practice are plagued by data-mining bias.
Instead, we will select strategies based on the results from a portfolio backtest in the in-sample. The two criteria below must be met:
(1) Portfolio backtesting must be done with in-sample data to avoid data-snooping
If the testing includes out-of-sample data, then this introduces forward looking bias.
(2) The portfolio must include low correlated and anti-correlated securities and must be selected in advance
We used DIA, EEM, GLD, IWM, QQQ, TLT, XLE, and XLF with data from inception to end of in-sample period on 12/31/2010. Selecting a portfolio that generates the best results based on out-of-sample results causes data-snooping bias.
Needless to say that the above two conditions are frequently violated by some system developers and the results are statistically not significant although they appear so.
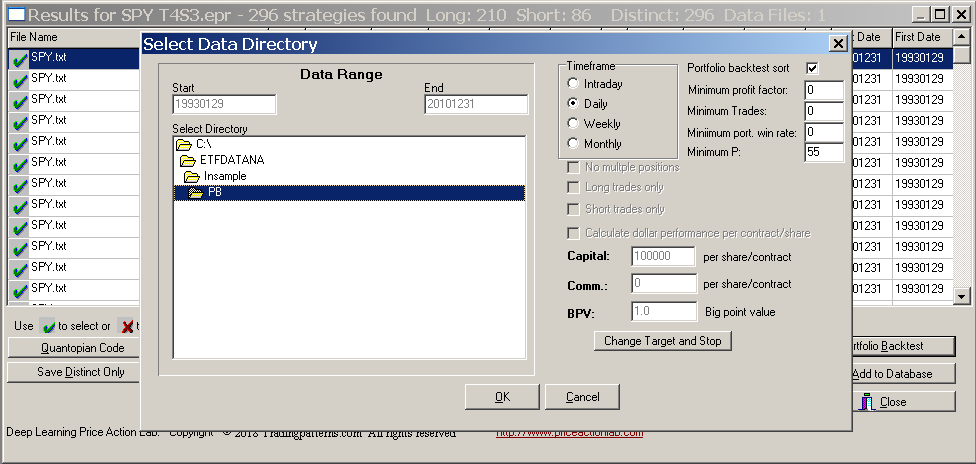
DLPAL S offers an advanced and efficient portfolio backtest tool. Each strategy in the results can be backtested on a group of securities. The tool also allows sorting the results according to four criteria (a new criterion will be available in v2.5) and displaying only those strategies that meet them. In our case, we want the win rate of the strategy P (new criterion in v2.5) when tested on the portfolio to be higher than 55%. Below is how to select the portfolio and set the parameters:
The results are shown below:
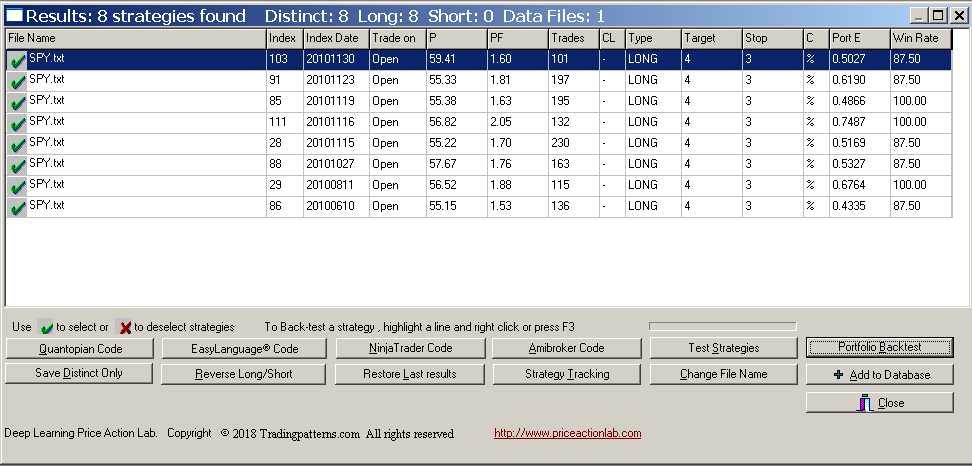
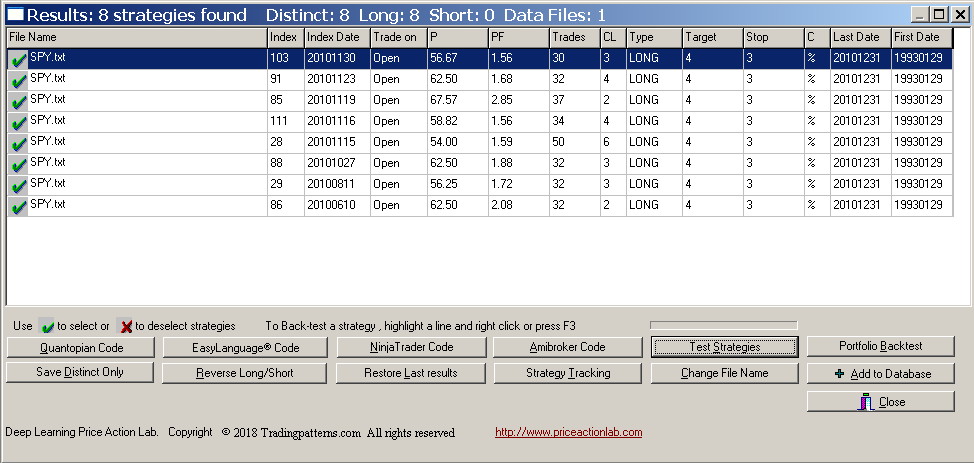
There are eight long strategies that satisfy the criteria of the portfolio backtest. These strategies are profitable when backtested on the portfolio with a win rate of 55% or higher and also profitable in more than 87.5% of the securities, as shown under Win Rate. Therefore, this is a selection bias minimization step with in-sample results. Before generating code for Amibroker we have to restore normal results using Test Strategies tool and selecting in-sample or out-of-sample data:
Below are the out-of-sample backtest results in Amibroker of a system consisting of only those eight strategies with code generated by DLPAL S:
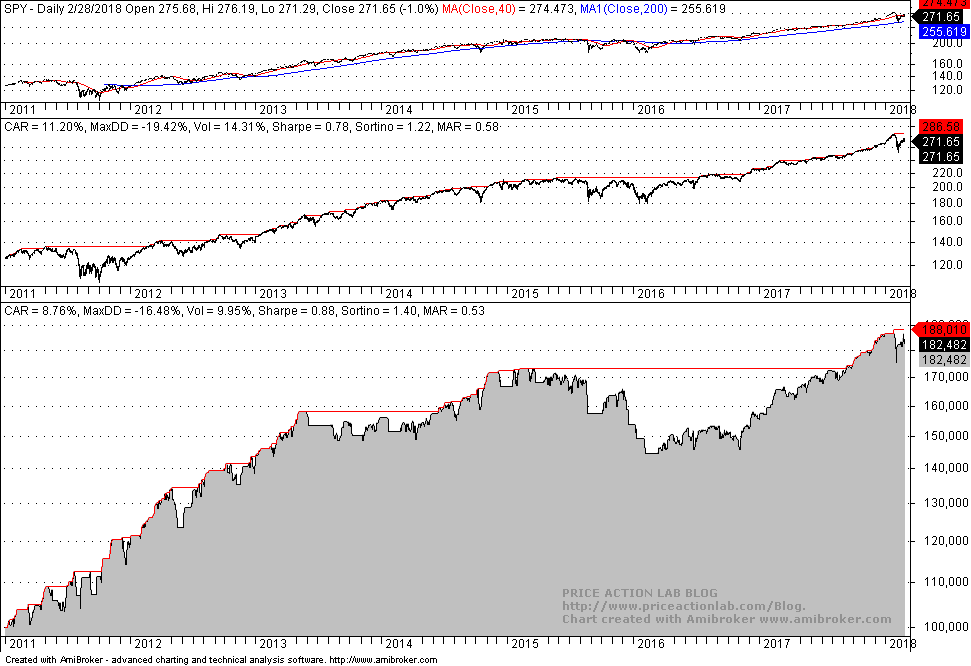
There is remarkable improvement in the performance in the first two years. Actually, the equity increases steadily while the actual buy and hold market is in whipsaw. Below is how results compare:
| Parameter | All results | Selected Results | Buy and Hold |
| CAGR | 8% | 8.8% | 11.2% |
| Max. DD | -21.3% | -16.5% | -19.4% |
| Sharpe | -0.61 | 0.88 | 0.78 |
| MAR | 0.37 | 0.53 | 0.58 |
| Trades | 302 | 61 | – |
| Strategies | 296 | 8 | – |
CAGR, Sharpe and MAR are higher for the selection of eight strategies while maximum drawdown is lower. We have managed to get this improvement while minimizing selection bias using a portfolio backtest.
R balancing of the system could be made after the second year. But the objective of this article was not to develop a system but to show how to use portfolio backtests to select strategies. Note that the effectiveness of sorting criteria varies from market to market but as long as no data-snooping is introduced selection bias is minimized. The worst practice is to use out-of-sample data to evaluate the results and restart the process as it is often done by some developers and regrettably suggested by some authors of software. One must adhere to the two criteria mentioned at the start for the bias to be minimized, otherwise the bias increases and results are random although they may appear good.
You can download a demo of DLPAL S from this link. For more articles about DLPAL S click here.
If you have any questions or comments, happy to connect on Twitter: @priceactionlab
Subscribe via RSS or Email, or follow us on Twitter.
Disclaimer: No part of the analysis in this blog constitutes a trade recommendation. The past performance of any trading system or methodology is not necessarily indicative of future results. Read the full disclaimer here.


