


How do you test the robustness of a process that automatically develops trading strategies? There a few methods for achieving that but their effectiveness depends on the market conditions included in the data sample used for validation of the results.
If you want to determine the robustness of a data-mining process that automatically identifies and configures trading strategies some basic guidelines must be followed, otherwise the process may be biased and its results spurious. Data mining is a usually a source of spurious correlations since the hypotheses are suggested by the data.
Some developers of software that identifies trading strategies from market data often use validation samples that do not include adverse market conditions, such as the 2008 crash. This makes validation easier and results often appear robust. Some even use Monte Carlo simulation but this method is not applicable to data mining.
Out-of-sample testing is a popular test assuming it is not abused because out-of-sample performance is an unbiased estimator. Testing the integrity of a data-mining process used to develop trading strategies out-of-sample should include the following:
- At least one bull and one bear market in the out-of-sample
- Testing all generated strategies out-of-sample
Including both bull and bear markets means data-snooping bias and data dredging are reduced. In addition, selecting strategies that perform well in the in-sample and/or out-of-sample introduces selection bias and to minimize it all generated strategies above a reasonable threshold of performance must be used.
Note that the purpose in this study is to assess the robustness of the data-mining process and not to develop a final trading strategy but these two are inextricably related.
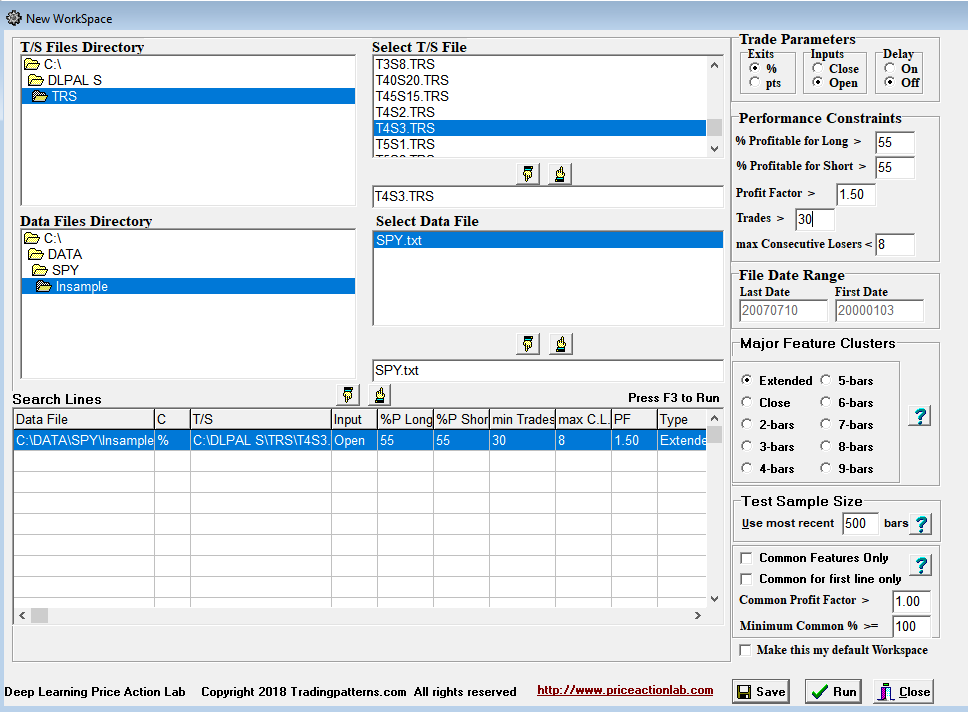
In our example, we use DLPAL S software to develop a system for trading SPY ETF with 4% profit target and 3% stop-loss. We chose a profit target larger than the stop-loss because it is easier to find strategies with low reward/risk ratio but those often have larger risk of failure in case a bad streak of consecutive losers. In our terminology, a system is a collection of strategies.
The in-sample for strategy identification is from 01/03/2000 to the top of the 2007 bull market on 07/10/2007. The out-of-sample includes the 2008 bear market and covers the period 07/11/2007 to 08/17/2018. All the search parameters are shown in the DLPAL S search workspace below. Note that we have set the minimum number of trades for each identified strategy to 30 and the minimum win rate to 55% for both long and short strategies. Normally, for a given search DLPAL S identifies several strategies that fulfill the criteria. The extended search option was used in this example.
The results of the search are shown below.
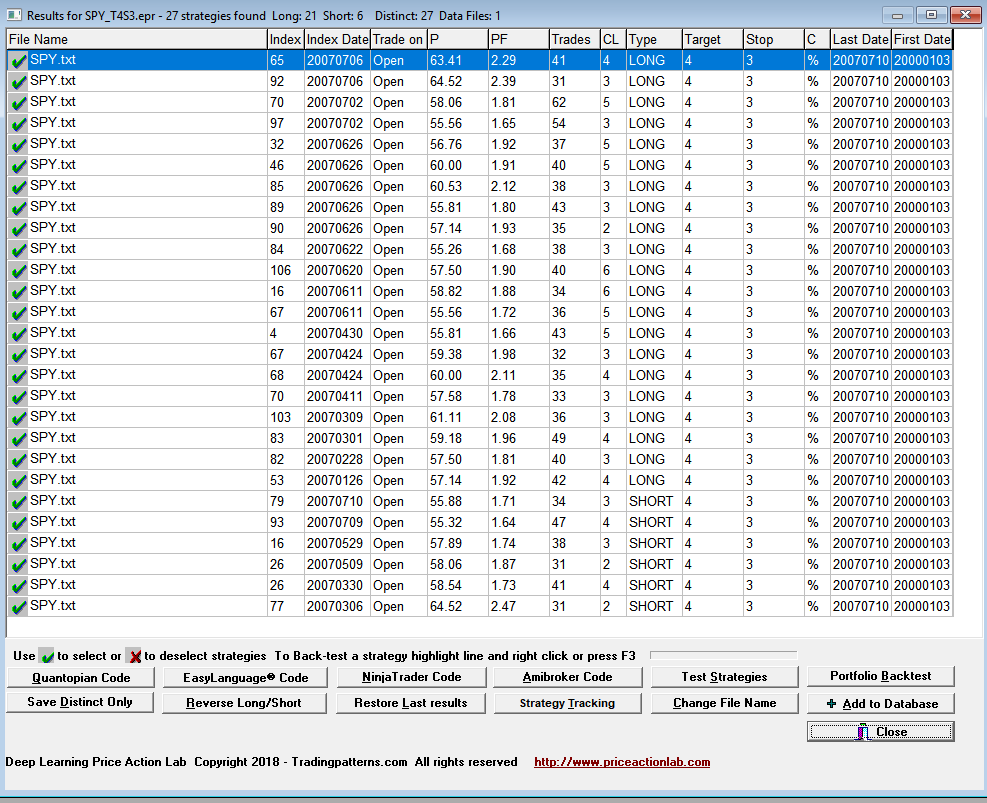
DLPAL S identified 21 long and 6 short strategies that fulfilled the search criteria. Next we had the program generate code for Amibroker for a system that includes all strategies identified in the in-sample. Below are the results of the backtest in Amibroker. Commission of $0.01 per share is included. The middle chart shows the performance of buy and hold in the out-of-sample and the bottom chart the system equity performance.
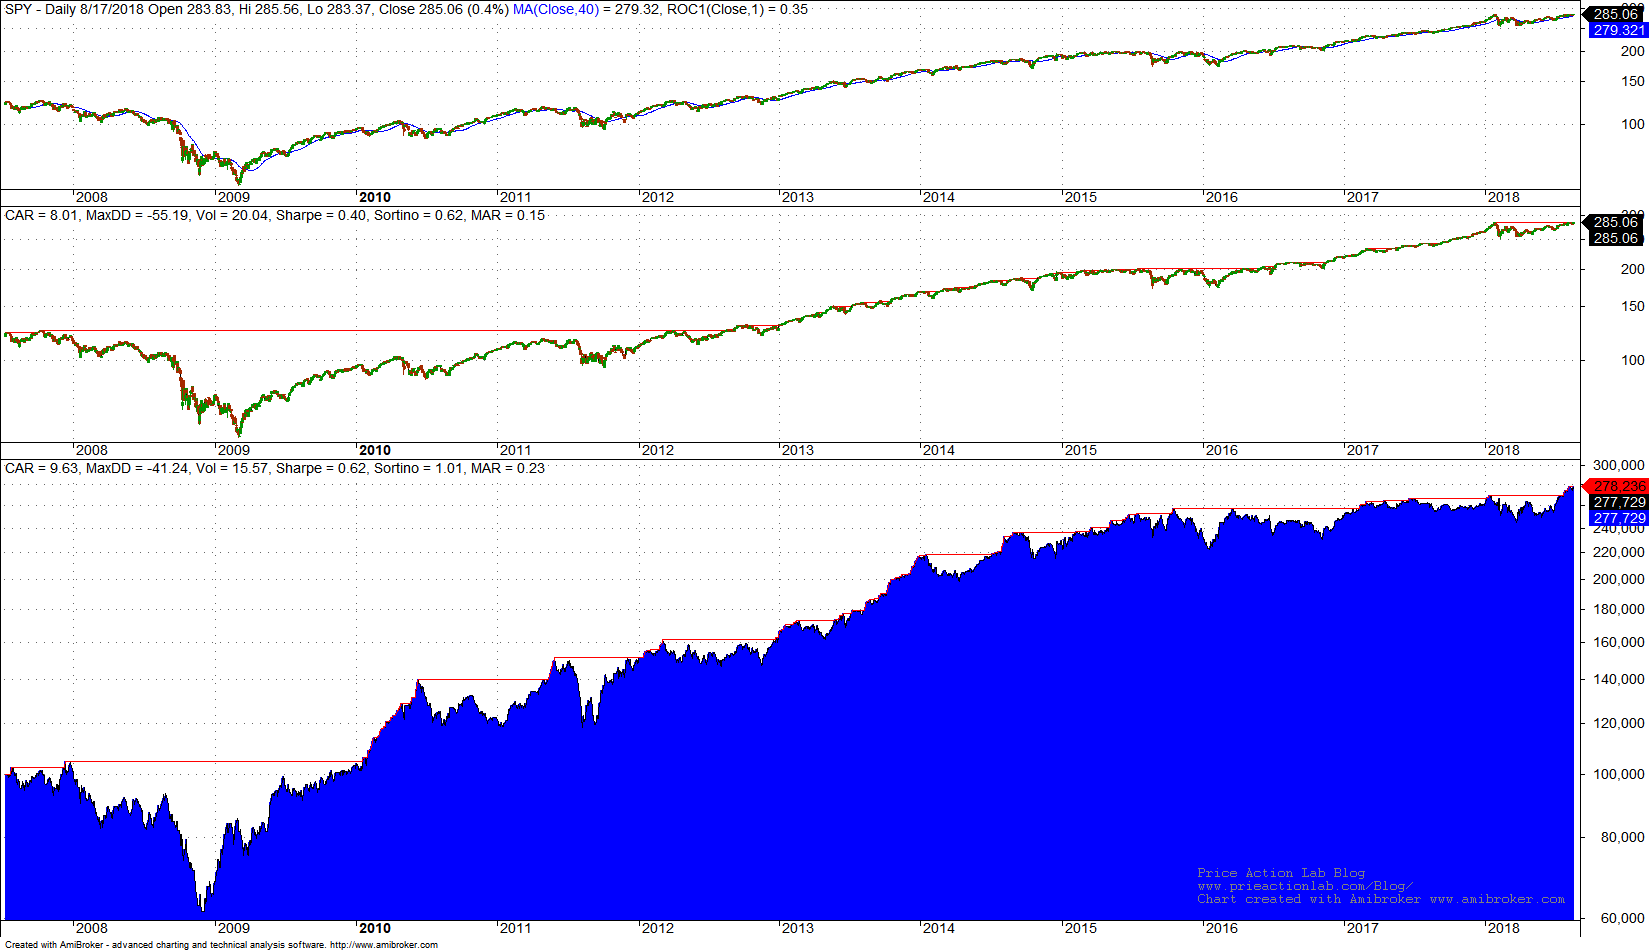
Despite a large drawdown of 41.24% during 2008, CAGR of the DLPAL S system in the out-of-sample is 9.63% versus 8.01% for buy-and-hold. Risk-adjusted performance is higher for the DLPAL S system with 0.23 MAR versus 0.15 for buy-and-hold.
These results confirm the robustness of the data-mining process used in DLPAL S for identifying strategies. Out-of-sample performance of all strategies combined in a system is better than buy-and-hold despite the bear 2008 bear market and the strong uptrend afterwards. Here are some interesting details referring to returns:
- In 2011 the strategy generated 1.7% return versus 2.6% for buy-and-hold
- In 2009 the strategy generated 50.3% return versus 26.1% for buy and hold
- In 2015 the strategy generated 2.5% return versus -4.6% for buy-and-hold
Obviously, this is not a final system to use. A lot more work must be done for a final system. We have only confirmed the robustness of the data-mining process.
Also note that even if the data-mining process is robust, that does not mean that every strategy or system generated will perform well. Performance depends on in-sample and forward conditions. If the data-mining is not used properly or abused, the results will be spurious despite its robustness.
In general, after the integrity and robustness of a data mining process are verified, it is better to use the full history available to develop a system. In this way the system is exposed to a wide variety of market conditions in the design and test phase. For example, one method to use in developing a final system along these lines is walk-forward strategy development.
More articles about using DLPAL S can be found here.
You can download a free demo of DLPAL S from this link.


