


Developing trading systems on an in-sample of historical data and then testing the results on an out-of-sample is a widely used practice that hides some fundamental flaws. In this article I list some of the problems that may arise from the wrong application of out-of-sample testing and I discuss an alternative method that involves testing a trading system on a much wider range of market conditions while at the same time it makes full use of historical data during the development phase.
This article has two part, I and II. Part I conveys the main message and Part II includes some examples.
Part I. Introduction
After a trading system is designed, either manually of by a machine, it is important to know whether it is a random selection that happened to fit well to the data or it has some kind of intelligence in pairing raw market returns with its signals. A common practice employed by developers is to split the data in an in-sample and an out-of-sample, develop the system on the former sample and then validate the results on the latter sample. This practice has several inherent drawbacks and flaws and some are listed below:
(1) Use of out-of-samples limits the amount of data available during the development phase. (Usually 4/5 of the data are used as the in-sample and the remaining 1/5 as the out-of-sample. )
(2) If the out-of-sample involves conditions similar to those found in the in-sample, the validation results will be positive. For example, a trend following system developed on an in-sample with several trends will probably perform well on an out-of-sample that is mainly composed of a single trend. Many stock traders were fooled by a similar situation when developing systems during the 1990s when there was a strong upward market trend. On the other hand, if the out-of sample includes only adverse conditions, then the system will not be given a chance to prove itself and it will be rejected. An example is again a trend-following system and an out-of-sample with only choppy price action. Since a trend following system profits from capturing trends, it would be unfair to evaluate it on just sideways price action. A well-balanced sample should include several trends of various magnitudes and several sideways periods in between them to determine whether the profits made from trend following are multiples of the losses accumulated during sideways periods.
(3) If the process makes use of data-snooping, as it is the case with some genetic programming algorithms that permute indicators based on the optimization of a fitness function, the probability of finding a trading system that passes the out-of-sample test is, for all practical purposes, equal to 1. In other words, if at every step of the process some test results on the same data are ignored and a final selection is made that optimizes some objective, then given enough permutations one may find a spurious model that may pass cross-validation tests by chance alone. Even in the case that the fitness function is evaluated based on the performance on a number of historical data files, with such as a portfolio of securities and given enough permutations the probability that the final result passes all cross-validation tests approaches 1 but the model may still be spurious.
Solutions to (3) above have been proposed that attempt to control Type I errors (the incorrect rejection of the null hypothesis that the system has no intelligence or that its returns were drawn from a distribution with zero mean return) have a serious flaw as they need to consider all possible models. In the case of trading systems designed via the use of genetic programming, the number of all possible models may be in the order of billions or trillions and a good part of them may be irrelevant. In the case of manual design, the term “possible model” is quite ambiguous. Thus, although fancy algorithms have been proposed to tackle this problem, they lack a foundation and they are mostly impractical. They can also be detrimental to the design process because in their effort to control for Type I errors they introduce Type II errors and as a result some good results may be rejected.
Testing on comparable data rather than on an out-of-sample
The method of testing on comparable data is the oldest used and traders refer to it as the requirement that “a system must perform well over a good number of markets”. However, due to the limited availability of data when the method was initially proposed it lost its appeal and methods such as bootstrapping and Monte Carlo simulations gained popularity. However, thanks to the introduction of ETFs in the mid 1990s, now there are plenty of comparable historical data series to use in the testing of equity and fixed income trading systems. In the case of futures and currencies, about 20 years of more data are now available since the method of testing on comparable data was proposed. Thus, there are no more excuses for using out-of-sample testings that can be misleading and one should test a system developed on the whole available price history of a given market and on a sufficient number of other markets to determine its performance. But this must be done correctly and below are some suggestions:
(a) Comparable data is a general term and it does not necessarily refer to comparable securities but mostly to the requirement that the data structure must be comparable in the sense that if a system uses the Close and the Volume, for example, the comparable series must also have Close and Volume available.
(b) The portfolio to test a system must be selected a priori and not posteriori. This is very important because any post hoc selection is equivalent to cheating and reminds of the chartists who only see those patterns that worked while neglecting many others that did not.
(c) The portfolio must include positively but also negatively correlated securities to ensure that the system performs well over a wide variety of conditions and markets.
Part II. An example of a machine generated trading system
In this example a system for SPY will be generated by Price Action Lab using all available history of this ETF since inception and then it will be tested on a number of ETFs that have been used in this website for more than a year to provide short-term trading alerts. The list includes SPY, DBC, DIA, EEM, GLD, IWM, QQQ, SLV, TLT, USO, XLE and XLF.
Price Action Lab is a program that identifies parameter-less price patterns in historical data based on user-defined performance criteria. It was a deliberate choice back in the early 1990s when development of the algorithm of Price Action Lab started to consider only price patterns because they involve no free parameters and issues of curve-fitting through optimization were limited to the size of the exits, something that is controlled by the user and not by the data-mining process.
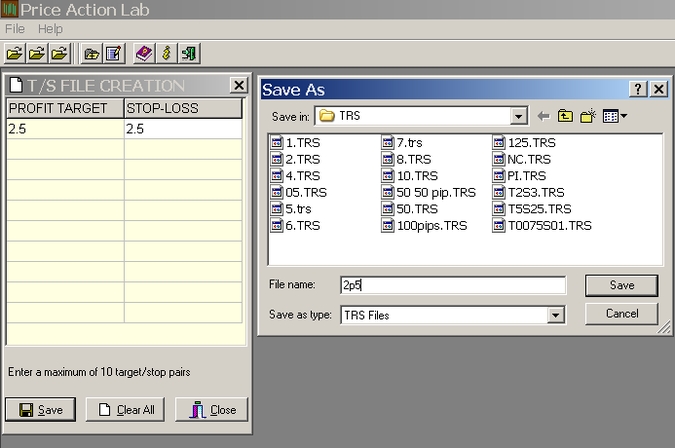
Step 1. Defining the market, timeframe and profit target and stop loss
In this example a trading system will be developed for SPY using non-adjusted daily data from the ETF inception (01/29/1993) to 05/24/2013. The profit target and the stop-loss are set at 2.5%. A T/S file is first created and saved in Price Action Lab as follows:
Step 2. Creation of a pattern search workspace
On the search workspace, the selection of data files and parameters that will guide the program in identifying price patterns is made:
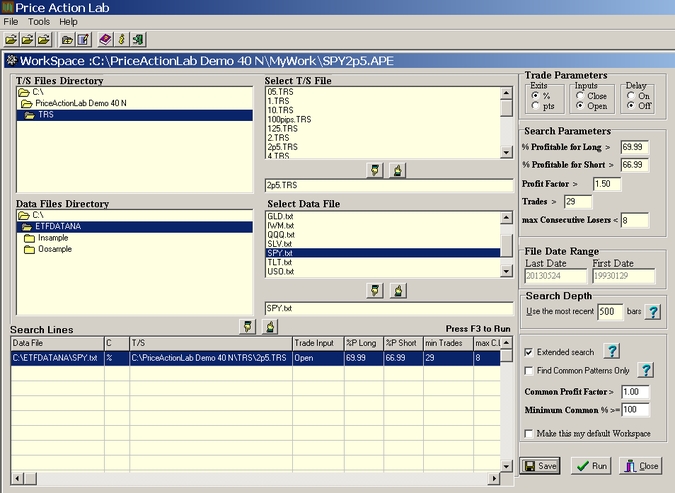
The workspace is created by selecting the following:
a) The T/S file we created by the name 2p5.trs
b) The data file SPY. txt
c) The trade parameters: ”%” is marked to indicate that the values in the selected T/S file stand for percentages of the entry price, which is selected as the open of the next bar under Inputs. The Delay input is kept marked off. (Using delay inputs will be the subject of another post).
d) Under search parameters we input 69.99 for the minimum win rate for long patterns and 66.99 for short patterns, 29 for the minimum number of trades, 1.50 for the minimum profit factor and 8 for the maximum number of consecutive losers (< 8). The other parameters stay at default values.
e) The date range in the data file is shown under File Date Range. In this case it corresponds to the in-sample range. The Search Range is left to 500. This means that Price Action Lab will demand that all patterns that are found to satisfy the performance criteria set in (a) – (d) must have at least one historical trade in the most recent 500 bars. Finally, the Extended search option is checked.
Step 3. Results
Price Action Lab will run for an interval of time depending on computer CPU speed but in this particular case it will complete the search after about 15-20 minutes on the average. The output should look like the one below (sorted for highest win rate P):
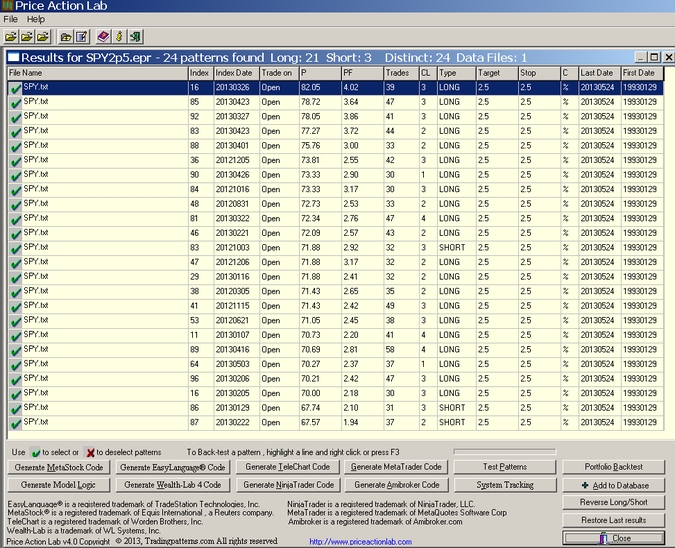
Each line in the above results corresponds to a price pattern that satisfies the performance parameters specified by the user. Index and Index Date are used internally to classify patterns. Trade on is the entry point, in this case the Open of next bar. P is the success rate of the pattern, PF is the profit factor, Trades is the number of historical trades, CL is the maximum number of consecutive losers, Type is LONG for long patterns and SHORT for short patterns , Target is the profit target, Stop is the stop-loss and C indicates whether % or points for the exits, in this case it is “%”. Last Date and First Date are the last and first date in the historical data file.
It may be seen from the results that Price Action Lab found 24 distinct patterns, 21 long and 3 short, which satisfied the performance criteria specified on the workspace. One could argue that these patterns are random and a result of survivorship bias, i.e. they survived by chance alone and they have no predictive power. This is one reason tests on comparable data will be carrried out below. But first note that:
– All patterns will be used as components of a trading system. There is no selection made from the results obtained.
– Price Action Lab does not find systems that later allow varying their parameters for fitting their performance in some in or out-of-sample. All patterns found are parameter-free, eliminating an important but serious concern dealing with curve-fitting.
– Price Action Lab does not use genetic programming, neural networks, permutations or any other methods employed by some other programs that very often produce random and curve-fitted systems. Price Action Lab is based on a proprietary deterministic algorithm that produces the same output each time it encounters the same conditions and that is in compliance with the standards of scientific testing and analysis.
The Test Patterns function is used next to get a quick calculation of key performance statistics for the search period:
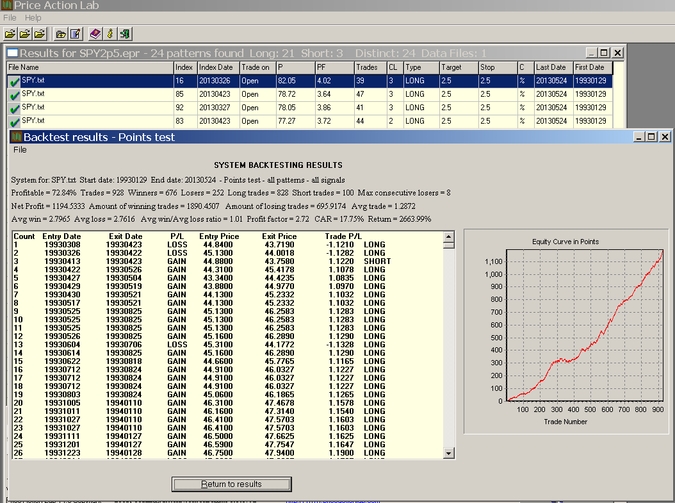
The above results include all signals from all patterns and thus involve multiple positions. It may be seen from the above results that the Compound Annual Return (CAR) is 17.75% for the system of 24 patterns since inception of SPY. As expected by design, the equity curve is upward slopping. However, the system just designed by the program may be curve-fitted and essentially random. For this purpose and as discussed before, we will test this system on 11 more comparable securities since their inception.
Example: Testing on IWM data
The following results were obtained after the symbol for SPY was replaced by IWM (this will be a feature of v4.1 to be released soon but it can be done manually at this point):
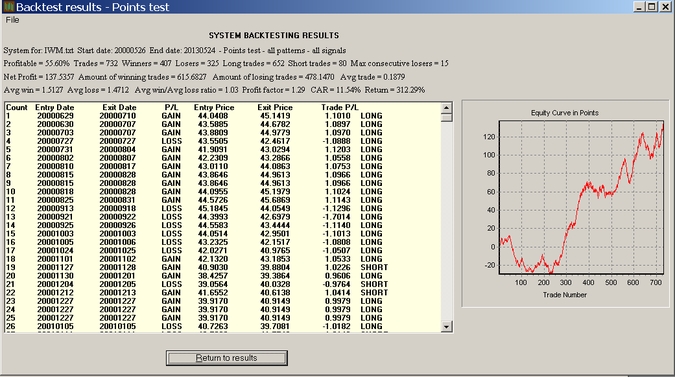
It may be seen that after an initial sluggish period and a drawdown, the system manages to produce a CAR of 11.54% for this ETF. One should not expect to see the same kind of a smooth equity line in comparable markets. We are only interested in noticing overall profitability and in this case the system passes the test.
Example: Testing on TLT data
This is an interesting test because after the financial crisis erupted, SPY and TLT have maintained a high negative correlation:
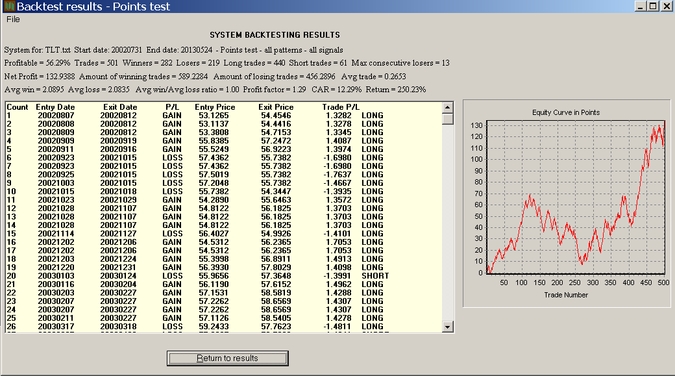
It may be seen that in this case the equity curve starts with an upward slope, then there is a drawdown without going negative and then a sharp rise. (Note that the actual percent drawdown of an account will depend on risk management parameters and equity.)
Summary of system performance
The performance on all 12 ETFs is summarized on the table below:
| ETF | CAR | Buy and hold |
| SPY | 17.75% | 8.72% |
| QQQ | 4.20% | 3.17% |
| IWM | 11.54% | 7.36% |
| GLD | 1.68% | 13.73% |
| XLF | 2.90% | 0.54% |
| DBC | 9.62% | 2.53% |
| TLT | 12.29% | 7.51% |
| XLE | 12.37% | 10.53% |
| USO | 5.97% | -9.68% |
| SLV | 8.70% | 6.54% |
| DIA | 9.42% | 6.81% |
| EEM | -0.27% | 15.25% |
Only in the case of EEM the performance was marginally negative. The system generated much above buy and hold returns for all ETFs except for GLD and EEM.
Comments and FAQ
How long will these patterns remain profitable? This is unknown and depends on whether there will be a massive change in market conditions. However, the real value in using software like Price Action Lab is that the search can be repeated every six months or every year, for example, and the systems can be upgraded. This is not like getting a black-box and have to live with it.
Can software tools make traders a lot of money? No tool can make anyone any money. It is the knowledge in using the tool properly and the hard work put that makes the money. For example, one can use a hammer to make a beautiful house and another to vandalize some work of art.
Related posts
https://www.priceactionlab.com/Blog/2013/04/selection-and-data-mining-bias-in-trading-system-development/
https://www.priceactionlab.com/Blog/2012/06/fooled-by-randomness-through-selection-bias/
https://www.priceactionlab.com/Blog/2012/08/fooled-by-multiple-comparisons-when-developing-systems-for-single-securities-or-portfolios/
https://www.priceactionlab.com/Blog/2011/09/curve-fitting-and-optimization/
https://www.priceactionlab.com/Blog/2010/10/proper-use-of-back-testing/
https://www.priceactionlab.com/Blog/2013/01/the-price-action-lab-spy2p5-system-outperformed-the-market-in-2012/
Disclosure: no relevant position at the time of this post.


