


Outside of regular trading hours, SPY ETF has increased by 11.4% versus 1.9% for year-to-date buy and hold. This implies that during regular trading hours the ETF has declined in value year-to-date. This is a notorious anomaly that may not disappear soon for reasons discussed below.
After 1999, as already widely known, all the gains in SPY ETF are due to overnight trading as opposed to regular trading session, which has contributed to losses, as shown in the chart below:
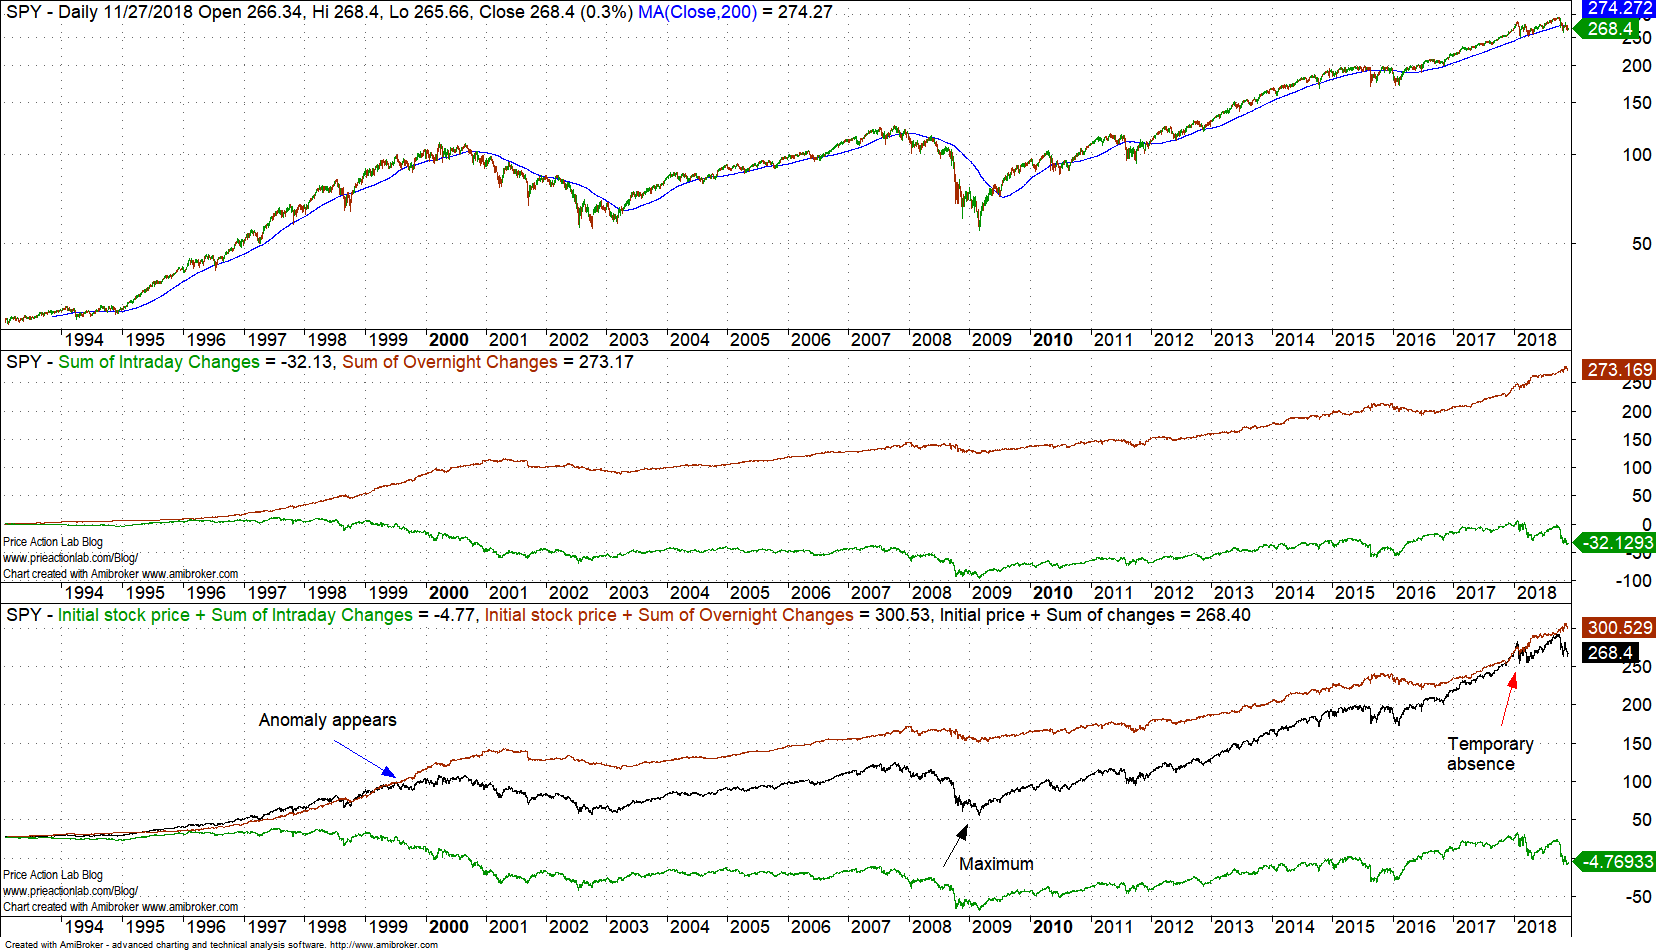
The first pane in the above chart shows the intraday (green line) and overnight (red line) accumulations in points. Since SPY inception, these are 273.17 for overnight versus -32.13 for the intraday. Without the intraday, current price would be at 300.53 versus the actual 268.40.
It may be seen that this anomaly emerged around 1999 and became most significant in 2009. Then in the beginning of this year is disappeared but only to emerge again in mid March. But note that taking advantage of this notorious anomaly involves the following adverse factors:
- Transaction cost
- Overnight risk
Both of the above adverse factors contribute to the persistence of the anomaly and especially the overnight risk as it deters traders from holding the ETF long overnight and selling it at the next open. Below is a chart since the beginning of this year:
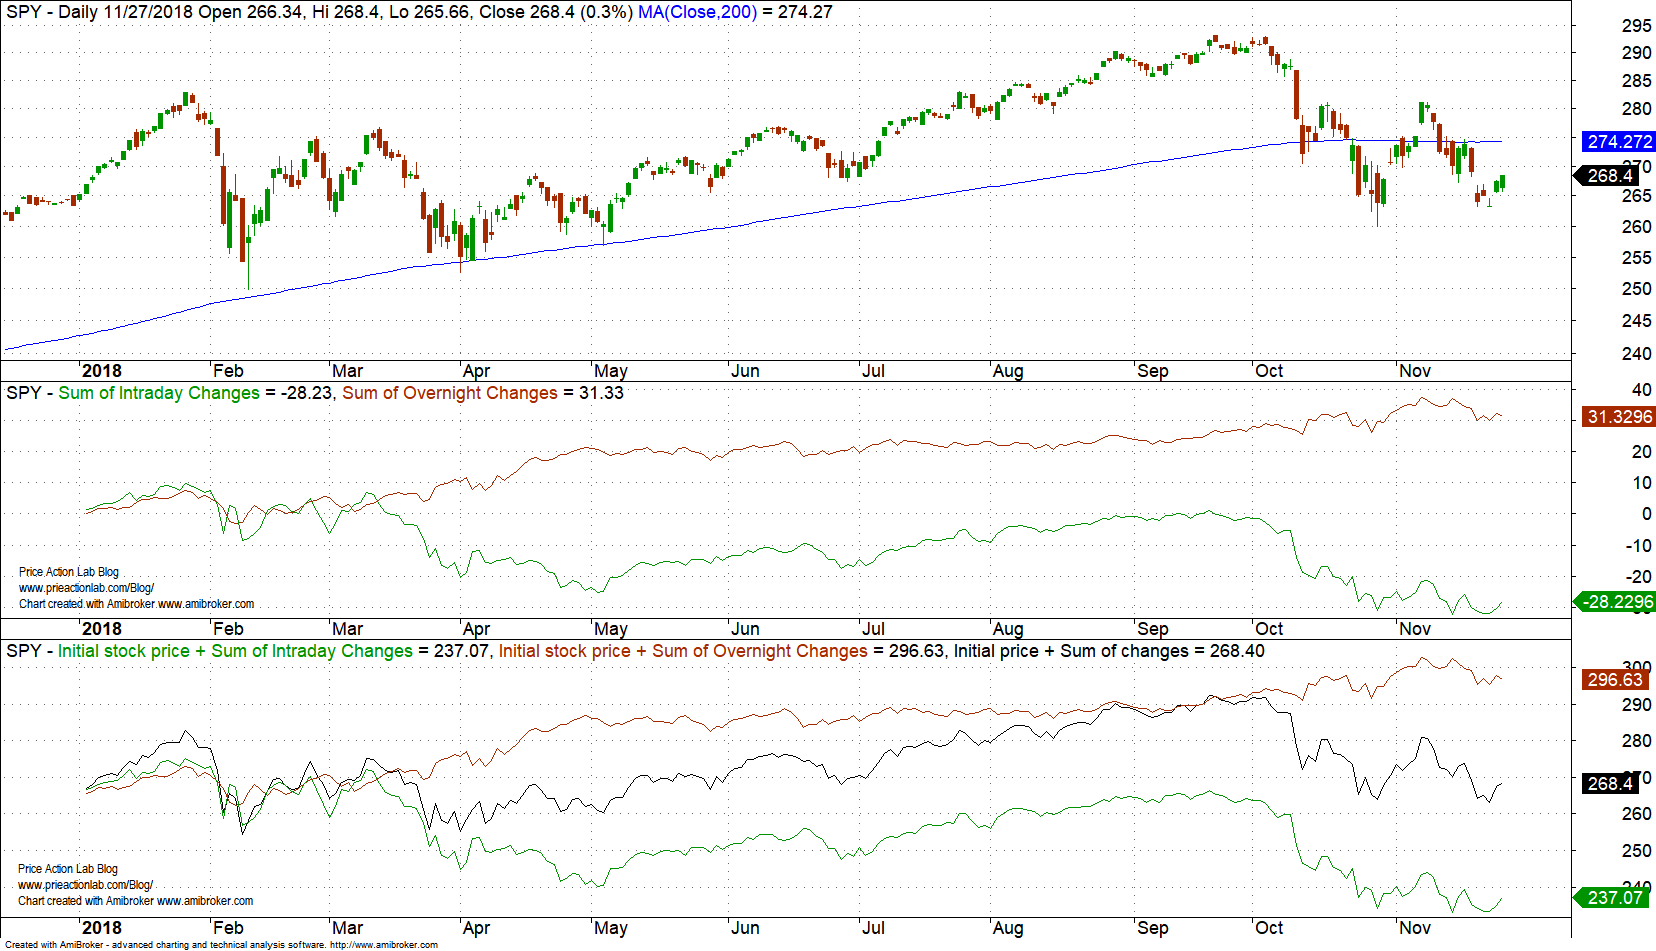
It may be seen that the price action anomaly reemerged in mid March after a temporary absence. The theoretical performance is 11.4% year-to-date for holding SPY ETF overnight versus 1.9% for buy and hold. But due to transaction cost the performance may vary widely. For example, for $0.02 per share commission and slippage, the return is 7.8% and if the friction is increased to $0.05 per share, performance is about 2.5%, or a little above buy and hold. Therefore, transactions costs but also overnight tail risk contribute to the persistence of this anomaly. Nevertheless, this is a notorious anomaly that shows markets that focus operation during specific time periods are not efficient and it does not make any sense to talk about efficient markets under such conditions.
In addition, this anomaly is present in some stocks. As we have already shown in this blog, it is present in AAPL, as shown below:

This anomaly became significant in AAPL during 2015 but faded early this year. It is highly possible that it will return again. But notice how all of the gains in the stock were due to overnight changes and activity during regular trading hours has contributed to a small loss only. This is extreme market inefficiency that is not supposed to be present.It is peculiar that so many people have become famous from touting efficient markets while no one who demonstrates their highly inefficient nature gets any attention.
If you found this article interesting, I invite you follow this blog via any of the methods below.
Subscribe via RSS or Email, or follow us on Twitter
If you have any questions or comments, happy to connect on Twitter: @mikeharrisNY
Charting and backtesting program: Amibroker
Market signals from systematic strategies are offered in our premium Market Signals service. For all subscription options click here.


