


This mean-reversion strategy generates daily and weekly signals for Dow 30 stocks and it is not data-mined but based on a formula found in a text on probability that describes fundamental behavior of price action.
The logic of this strategy is available for sale to professional traders and hedge funds subject to acceptance of a non-disclosure agreement. Weekly mean-reversion entry and exit signals of the strategy for Dow 30 stocks are included in Weekly Market Signals report. Daily signals are not included in our premium reports.
Note that this strategy was never coded or disclosed in a social trading platform or any other public forum.
Weekly Strategy
Strategy name: MRDOWW
Market: Dow 30 stocks
Time-frame: Weekly (adjusted data)
Strategy type: Mean-reversion, long-only
Score: Based on PSI5 algo (proprietary)
Market correction filter: Yes (no signals during large corrections)
Backtest period: 01/03/2000 – 02/15/2019
Maximum open positions: 20
Commission per share: $0.01
Position size per stock: Available equity/20
Trade entry: Open of next weekly bar after entry signal (no look-ahead bias)
Trade exit: Open of next weekly bar after exit signal (no look-ahead bias)
Performance summary of weekly strategy
| Parameter | SPY B&H | MRDOWW |
| CAGR | 5.3% | 6.7% |
| Max. DD | -55.2% | -15.4% |
| Sharpe | 0.27 | 0.78 |
| MAR | 0.10 | 0.43 |
| Trades | – | 4741 |
| Win rate | – | 67% |
| 2008 return | -36.8% | -2.4% |
| 2018 return | -4,6% | +9.3% |
It may be seen from the above performance table that the mean-reversion strategy has outperformed the benchmark in testing period on both absolute and risk-adjusted basis.
Below are the equity and underwater equity curves of the weekly strategy. Click on images to enlarge.
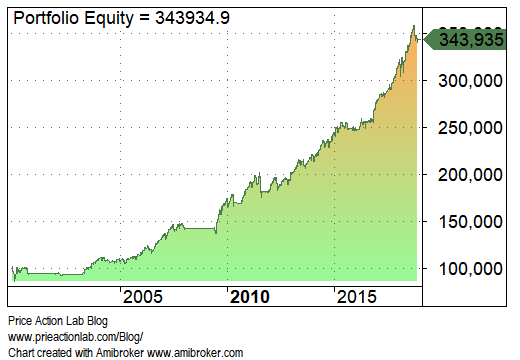 | 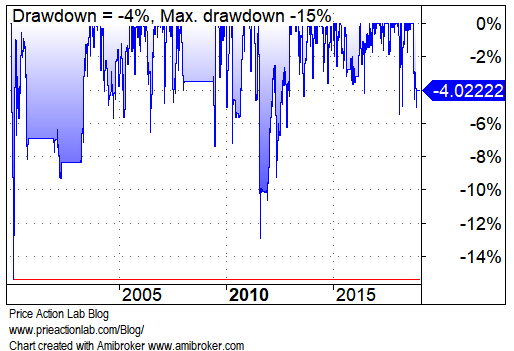 |
Monthly returns table for the weekly strategy: 01/03/2000 – 02/15/2019.
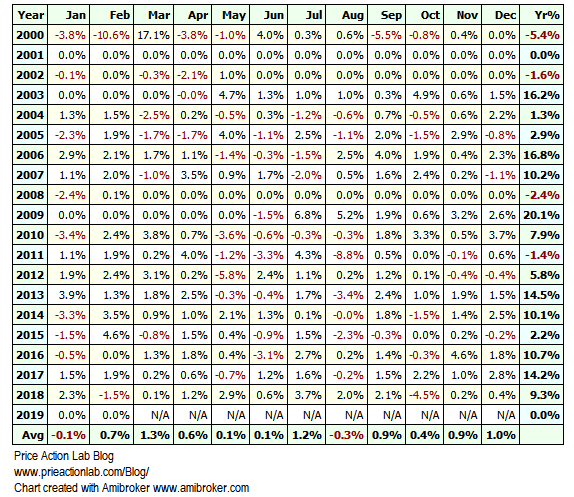
The weekly strategy has not generated any (closed) signals year-to-date due to correction filter.
Daily Strategy
Strategy name: MRDOW
Market: Dow 30 stocks
Time-frame: Daily (adjusted data)
Strategy type: Mean-reversion, long-only
Score: Based on PSI5 algo (proprietary)
Market correction filter: None (all signals taken even during corrections)
Backtest period: 01/03/2000 – 02/15/2019
Maximum open positions: 20
Commission per share: $0.01
Position size per stock: Available equity/20
Trade entry: Open of next bar after entry signal (no look-ahead bias)
Trade exit: Open of next bar after exit signal (no look-ahead bias)
Performance summary of daily strategy
| Parameter | SPY B&H | MRDOW |
| CAGR | 5.3% | 8.9% |
| Max. DD | -55.2% | -23.1% |
| Sharpe | 0.27 | 0.62 |
| MAR | 0.10 | 0.38 |
| Trades | – | 10066 |
| Win rate | – | 67% |
| 2008 return | -36.8% | +2.1% |
| 2018 return | -4.6% | -3.1% |
It may be seen from the above performance table that the mean-reversion strategy has outperformed the benchmark in testing period on both absolute and risk-adjusted basis.
Below are the equity and underwater equity curve of the daily strategy. Click on images to enlarge.
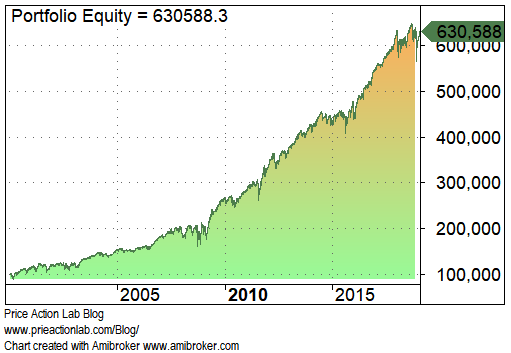 | 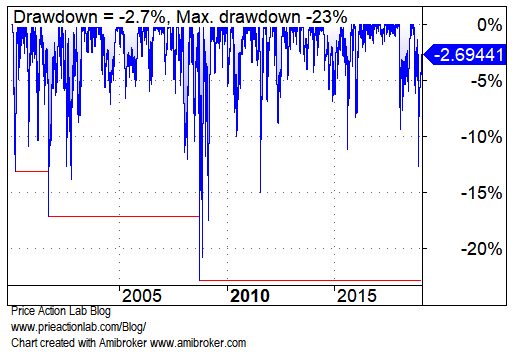 |
Monthly returns table for the daily strategy: 01/03/2000 – 02/15/2019.

Detailed weekly mean-reversion entry and exit signals for Dow 30 stocks based on this strategy are included in Weekly Signals.
Contact us if you have any questions.
Disclaimer: All performance results are based on backtests. No part of the analysis in this blog constitutes trade recommendation. The past performance of any trading system or methodology is not necessarily indicative of future results. Read the full disclaimer here.
All charts were created with Amibroker


