


In this article deal with conflicting signals arising from SPY ETF price action analysis as of the close of March 22, 2019. Two validation methods are used for this purpose.
Conflicting market signals are frequent in price action analysis. In fact, there are always conflicting signals and classical technical analysis users usually focus on those that confirm their market direction bias. In quantitative technical analysis validation methods are often used to discriminate between any conflicting signals. Below is a specific example and how we deal with this issue.
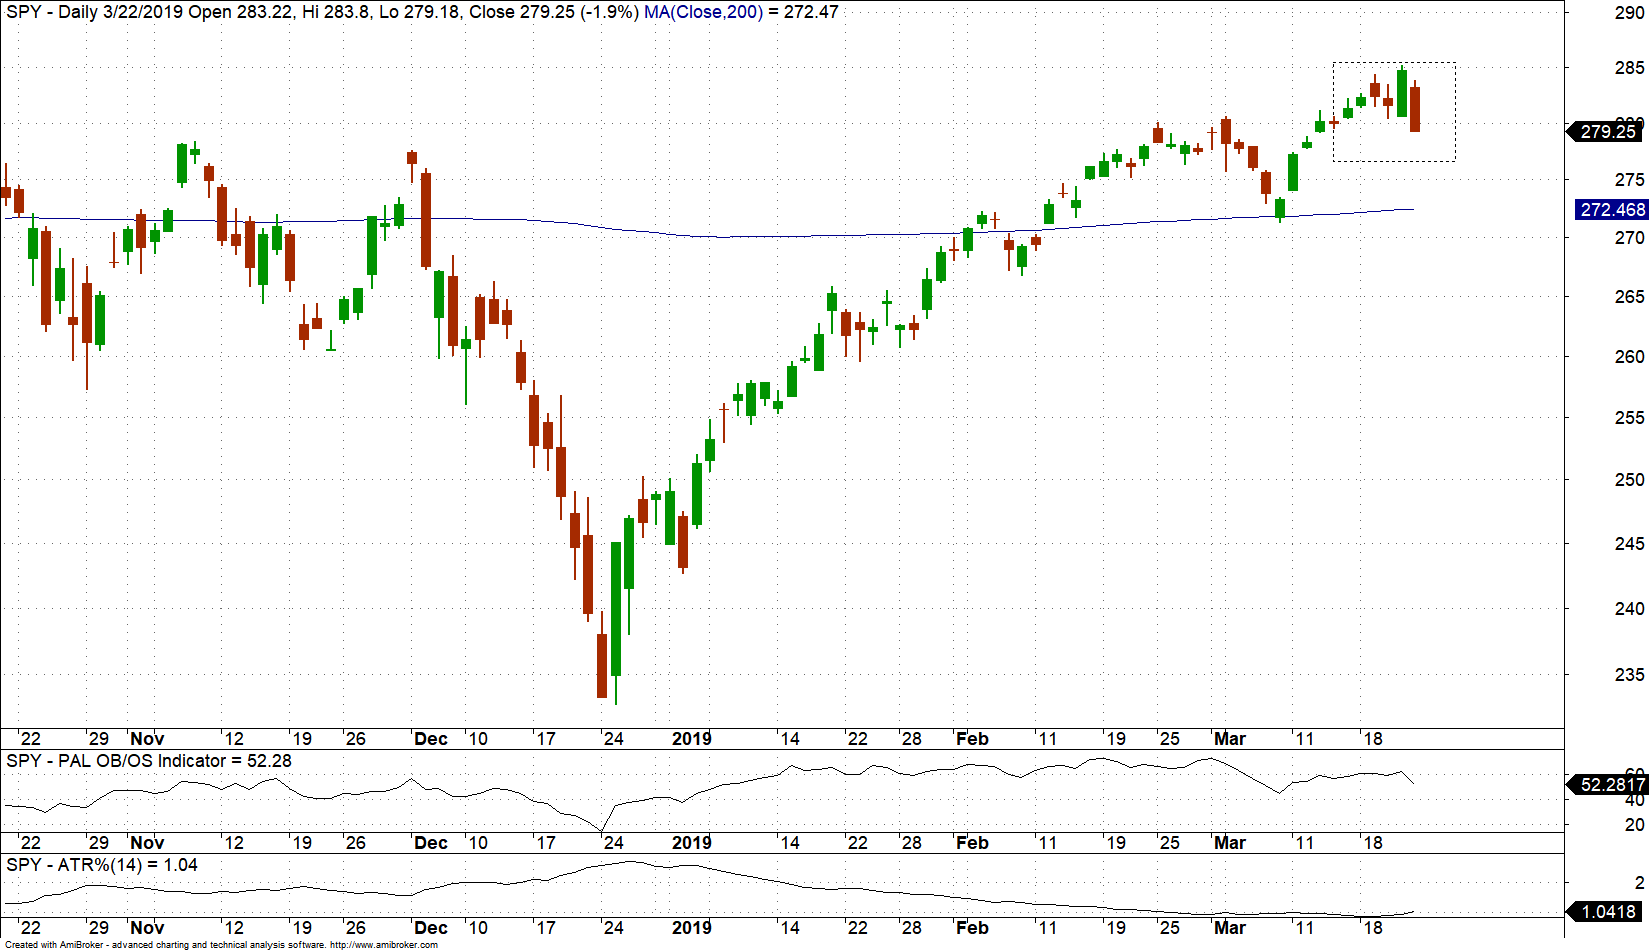
The daily SPY ETF chart below shows the pattern formed in the last 6 days. We would like to know if this is a bullish or bearish pattern.
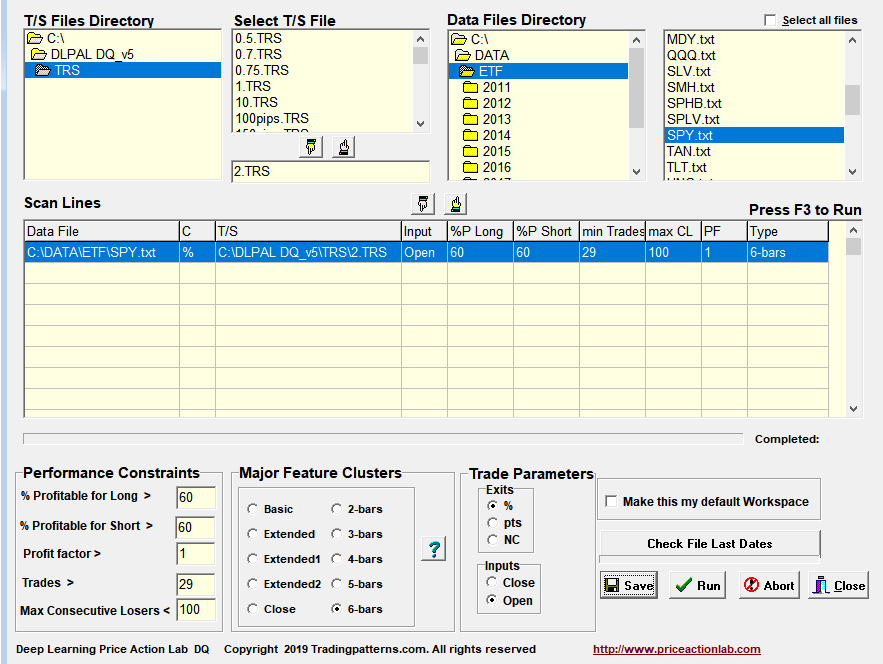
We use DLPAL DQ software to scan for 6-day patterns with more than 30 trades in the history of SPY ETF, win rate higher than 60% and profit factor greater than 1. We use profit target and stop-loss of 2% for price action anomaly classification.
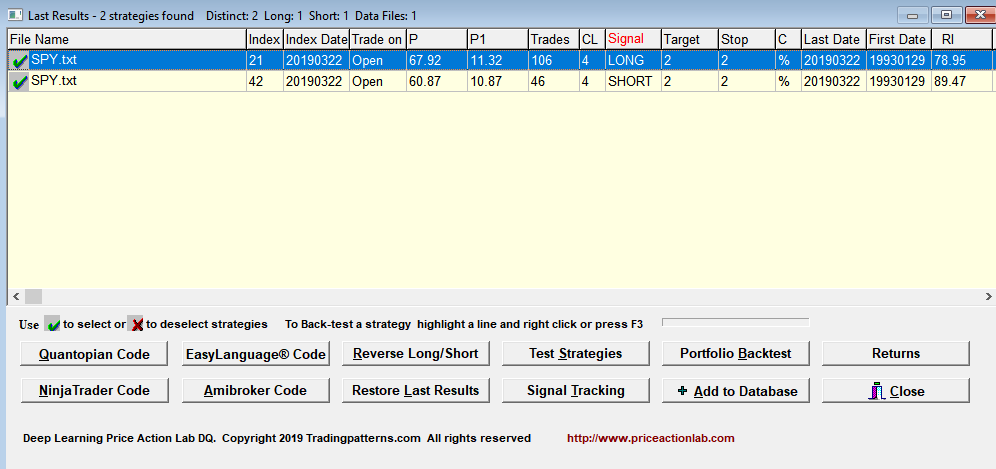
Below are the results of the scan.
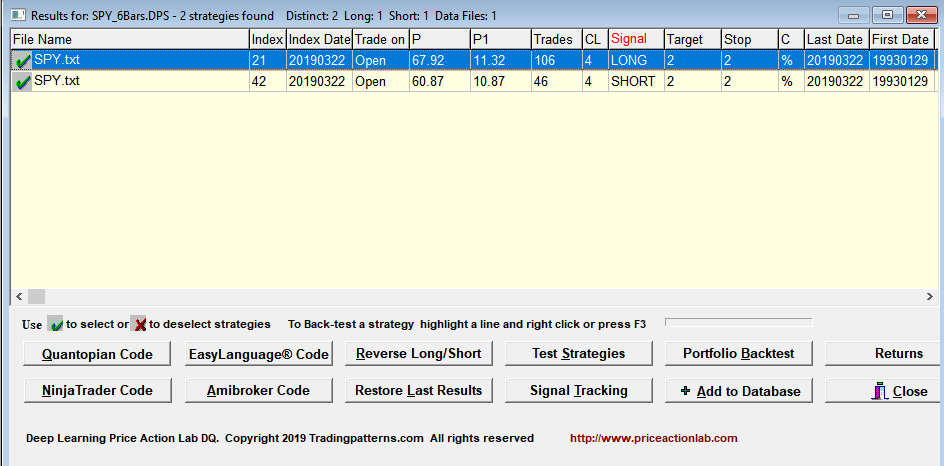
P is the win rate, P1 is the 1-Bar win rate, Trades is the number of historical trades, CL is the maximum number of consecutive losers, Target and Stop are the values of the profit target and stop-loss, C indicates the type of exits, in this case percentages added to entry price shown in Trade On as the open of next bar.
There are two price action anomalies (price patterns) one long and one short. Next we proceed with validation. DLPAL DQ performs a portfolio backtest for each pattern using 34 ETFs with data from inception to 03/22/2019 (any portfolio can be used.). This test increases the number of trades by two orders of magnitude, as shown under Trades.
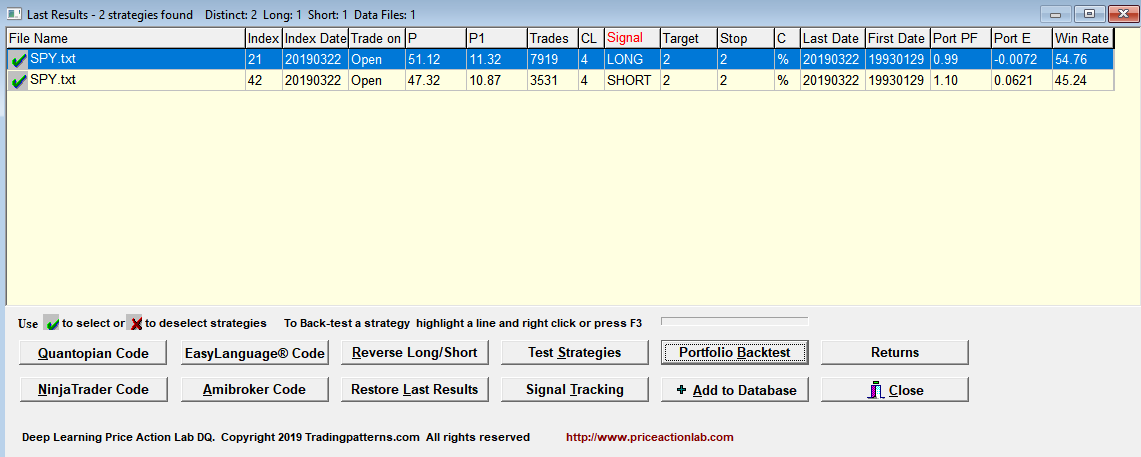
The portfolio profit factor Port PF is less than 1 for the long pattern and greater than 1 for the short. This is a preliminary indication that the short pattern has an edge over the long. Next DLPAL DQ performs a Robustness Test. This involves varying the profit target and stop-loss used for classification while maintaining the ratio constant and equal to 1.
Robustness RI is higher for the short pattern We conclude that there is high probability that the short pattern has an edge over the long.
Note that the above analysis is based on ensemble averages and as a result it only allows discriminating between conflicting pattern in the limit of sufficient samples. This is a limitation of quantitative analysis in general. Performance in time domain is not predictable but longer-term performance is assumed to be positive if applying validation consistently.
Click here for more info about DLPAL DQ.
If you found this article interesting, I invite you follow this blog via any of the methods below.
Subscribe via RSS or Email, or follow us on Twitter
If you have any questions or comments, happy to connect on Twitter: @priceactionlab
Charting program: Amibroker


