

Determining if a trading strategy is over-fitted can be a challenging task in some cases. In this article we offer an example of a strategy and a practitioner’s approach to determining whether it is over-fitted.
Over-fitted strategies are not hard to generate either by manual backtesting and optimization or by some algorithm that tests thousands, millions or even billions of combinations of indicators for entry and exit signals. For more details see this article.
Mathematical solutions suggested by academics usually fail to identify over-fitting due to very large bias as explained in this paper. Most of the complex solutions suggested by academics cannot deal with strategies over-fitted on particular market regimes that subsequently fail due to regime changes. In addition, if regimes prevail for long time, then the academic methods may generated high Type II error (false rejections) and prevent use of otherwise profitable strategies.
Below is an example of a strategy for ES futures that was provided by a quant during an interview:
Buy if TRIN >= 3
Sell if RSI(2) > 70
Trailing stop at 2 × ATR(20)
The experienced quant will immediately suspect this strategy is over-fitted and/or random. This is because this seemingly simple strategy has five parameters: The TRIN level to trigger a buy signal, the RSI period and level to trigger an exit and the ATR period and multiple for the trailing stop.
Below is the backtest of the strategy in backward adjusted ES futures EOD data. Starting equity per contract is $30K and position size remains constant. There are no commissions because we only want to analyze this strategy.
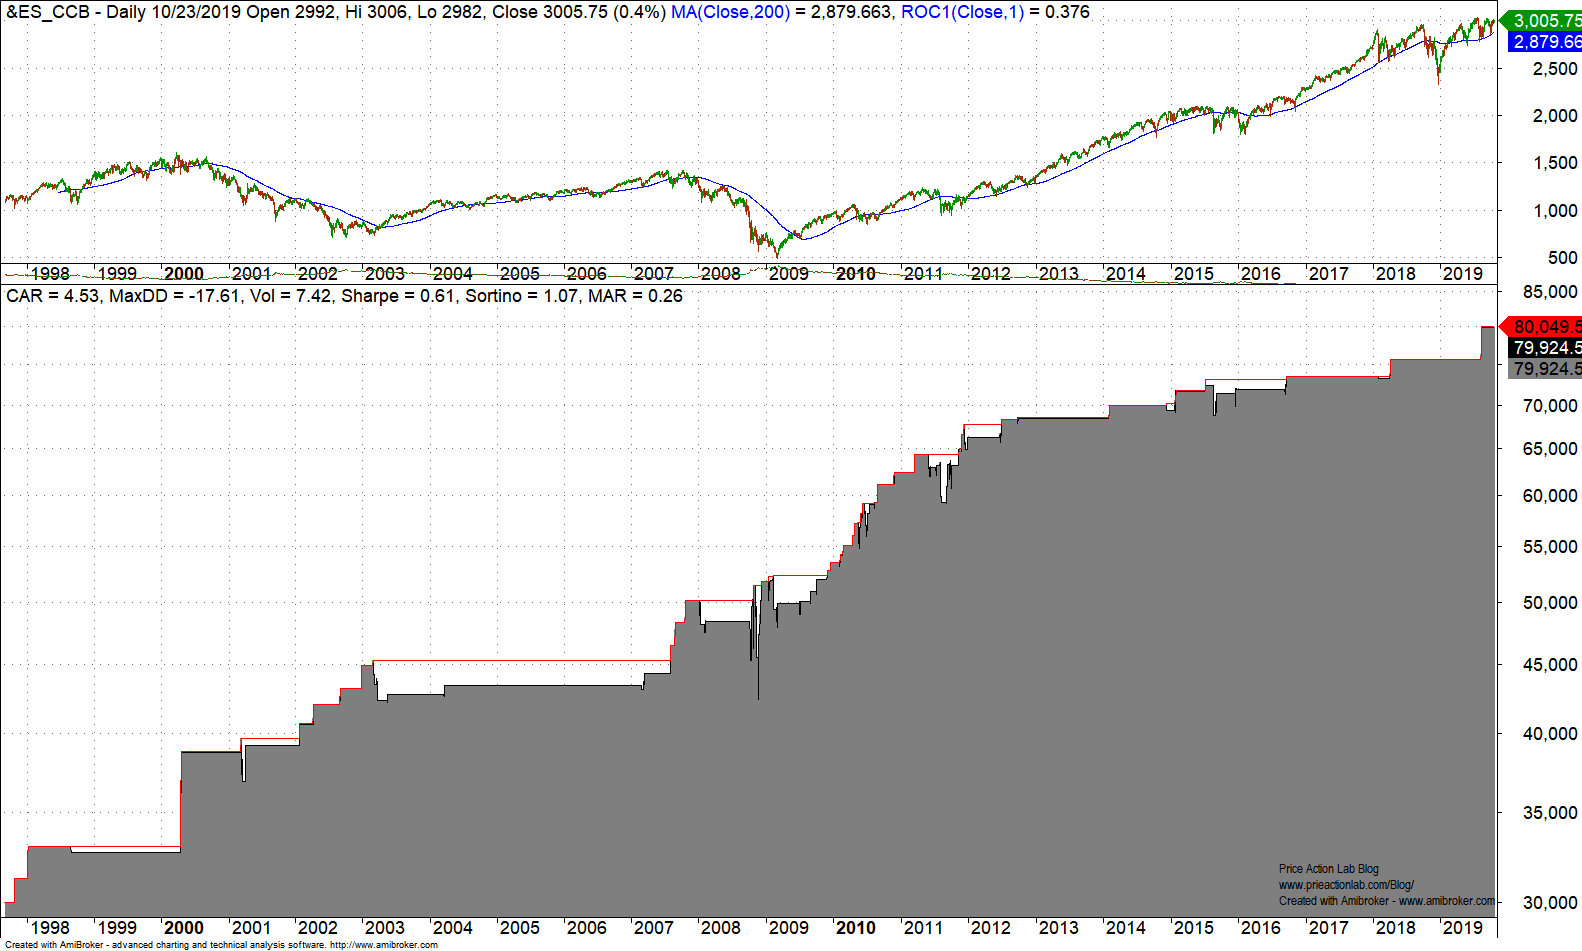
The backtest shows a rising equity curve at relatively low drawdown. The strategy generated 79 trades and win rate is 73.4%. Is this a genuine strategy or some random artifact of data-mining bias that was over-fitted on past data?
An experienced quant would immediately notice the following:
1) There are not enough trades to have a sufficient sample. Usually low number of trades for a final strategy indicates optimization.
2) Most trades were generated during two short periods and especially after 2012 there are only a few trades per year or even none. Specifically, there only 17 trades after 2012, or 1.75 trades per year on the average. There are no trades in 2017 and 2013.
3) Almost half of the trades were generated in the period 01/2009 – 12/2011.
4) Payoff ratio is only 0.57 but profitability is achieved through a high win rate. This is an indication of optimization but not proof.
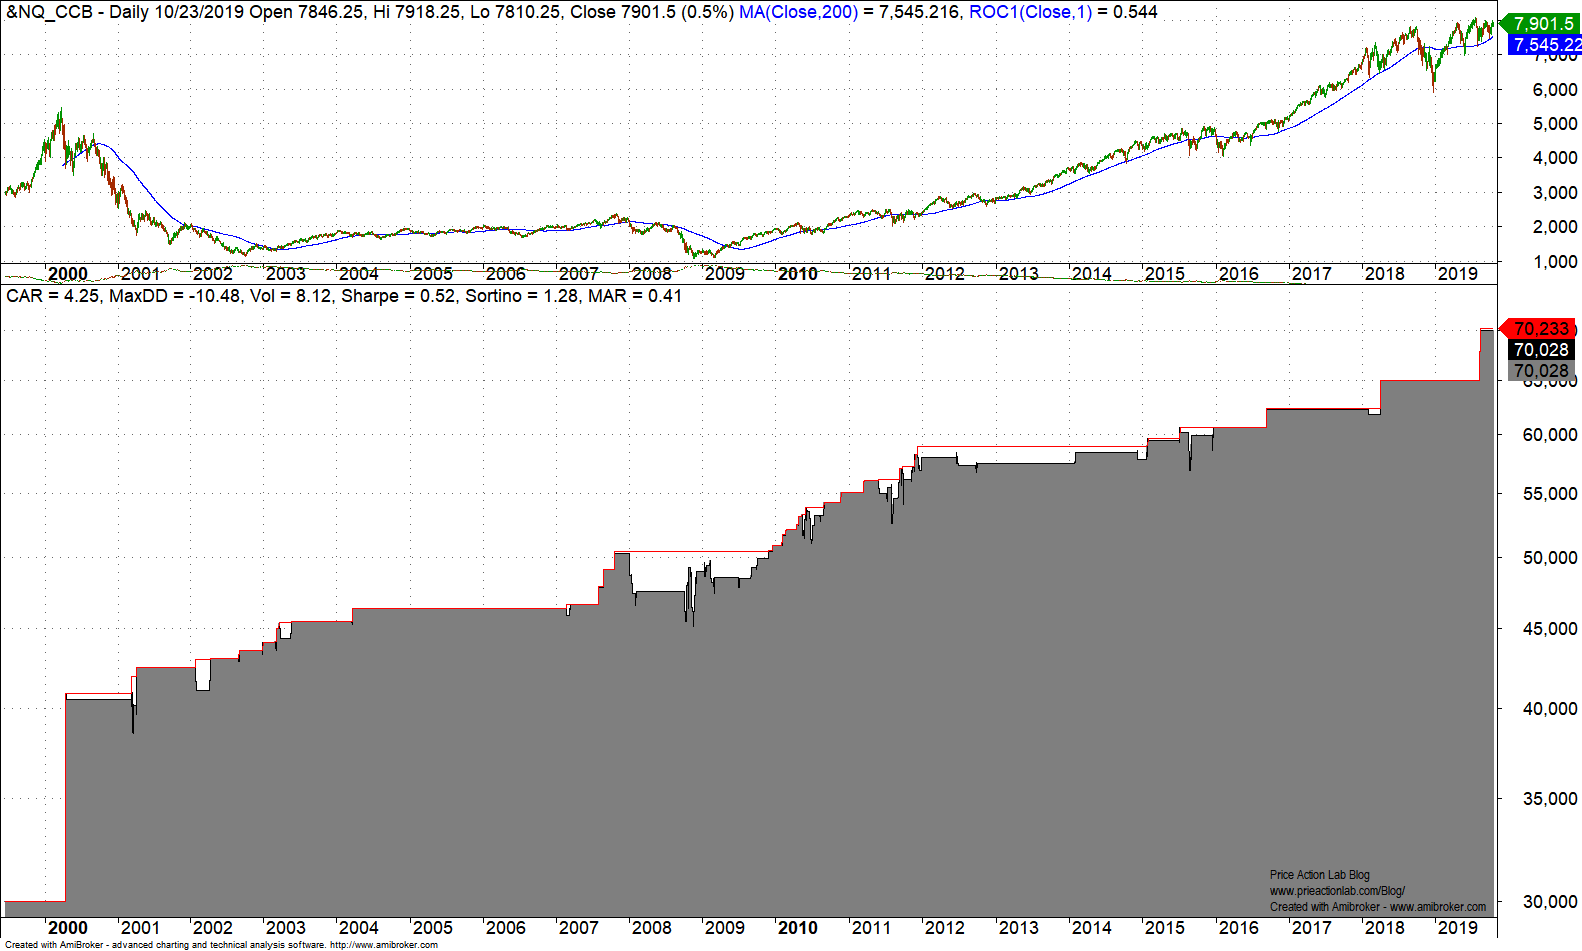
One of the problems with over-fitted strategies is that they may perform well on related markets because of correlation. Below is the performance on back adjusted NQ futures.
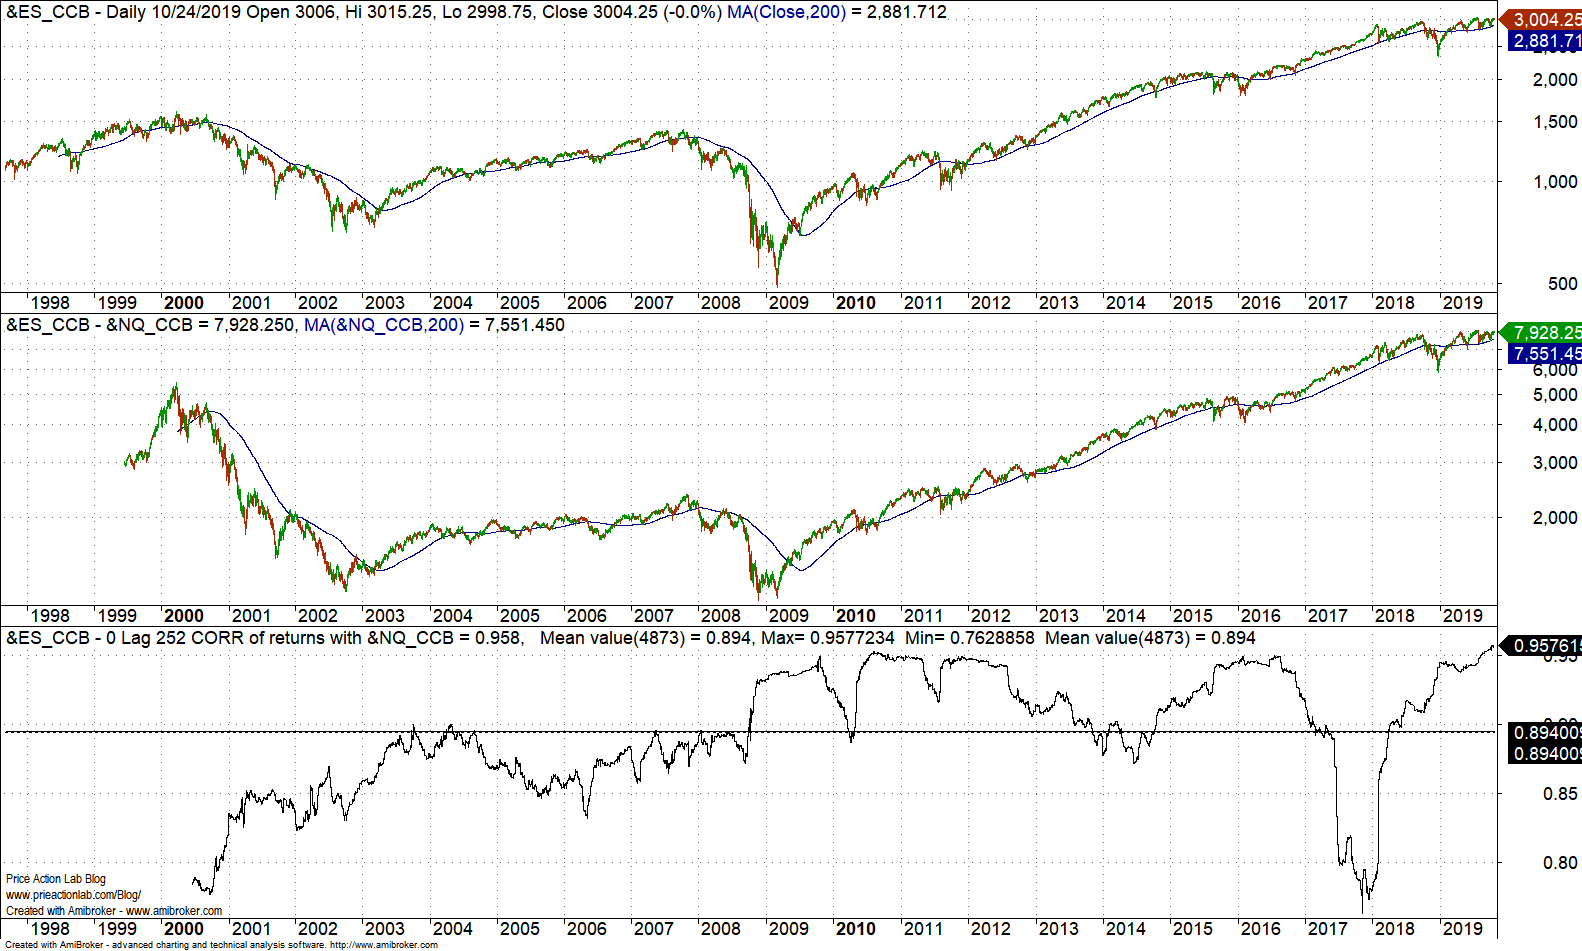
The above performance cannot be used as validation since the two futures contracts are correlated. As the chart below shows the minimum 0-lag, 252-day correlation between ES and NQ has been 0.76 and the maximum 0.96. The average correlation is 0.89. Therefore, tests on NQ or related contracts cannot validate the strategy.
So how to go about showing that this strategy is probably a fluke as hinted by 1 – 4 above?
We will look if the entry signal was optimized (procedure is detailed in the book Fooled by Technical Analysis: The perils of charting, backtesting and data-mining.) We look at performance for levels of TRIN between 0.5 and 5 in increments of 0.5. Below are the results sorted for highest MAR (CAR/Max. DD).
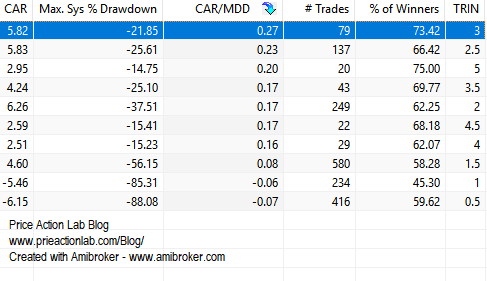
It may be seen that it just happened so that the choice of TRIN >=3 generated the highest MAR. All other choices generate either higher drawdown or lower CAGR or both. This is an indication that the strategy was over-fitted.
Next, let us suppose that a large number of random traders using a fair coin traded ES futures. If the strategy does worse than a sufficient percentage of them, maybe around 10%, then the probability that its return was achieved by chance is high. The return of the strategy was 166% in the backtest period from ES contract inception to October 23, 2019. Below is the simulation of 20K random traders executing long position in ES using a fair coin as generated by DLPAL S software.
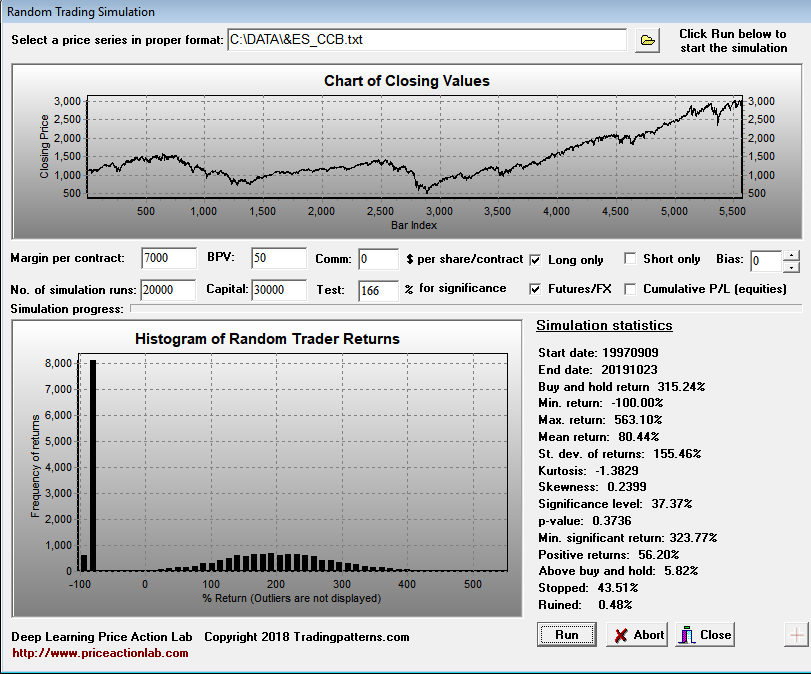
As it turns out, the strategy return of 166% ranked at 37.37% or 37.37% of random traders generated higher return than the strategy. Note that 43.5% of the random traders were stopped out when equity fell below margin amount. These results provide strong indication that the strategy is random and probably over-fitted.
Comments
Academic methods usually fail when the number of trials used to get a strategy is unknown, which is usually the case. Therefore, academic methods are theoretical and of no practical use in most cases.
There are no general ways of proving strategies are over-fitted. Every strategy must be treated separately and experience plays a role.
Over-fitted strategies may work well for extended period of time but when they fail, often due to regime changes, they usually never recover.
Trading strategy development is a practitioner’s field and not an academic subject. Academics may provide some theories but strategy development and analysis is both an art and a science.
Charting and backtesting program: Amibroker
Data provider: Norgate Data
Technical and quantitative analysis of major stock indexes and 34 popular ETFs are included in our Weekly Premium Reports. Market signals for position traders are offered by our premium Market Signals service
If you found this article interesting, you may follow this blog via RSS or Email, or in Twitter


