


Traders in social media posts have recently claimed that volume has lost its significance and is becoming irrelevant as a technical indicator. Some of these claims may be valid for some markets and strategies but not in general.
In algo-dominated markets it is possible that volume has no relevance as a technical indicator. In this article we show only an example of a strategy for trading S&P 500 stocks that indicates this may not be true under certain conditions.
The subject of volume significance in trading is complicated due to high non-linearity and a general study is difficult since that will depend on many factors, including specific markets, strategies and timeframes.
The strategy in this article uses monthly volume change as a ranking indicator to trade long-only up to ten S&P 500 stocks with positive monthly changes. Positions are established only if the index price is higher than its 12-month moving average. Positions are exited when the month return of a stock becomes negative.
We used Norgate data for S&P 500 index that also include current and past constituents. We highly recommend this data service to those who are looking to do some serious research in the area of equity trading strategies, directional but also long/short (we do not have a referral arrangement with the company.)

Timeframe: Monthly (adjusted data)
Index: S&P 500
Entry rule: Monthly return greater than zero
Exit rule: Monthly return less than zero
Strategy score: Change in monthly volume
Bear market filter: Close of S&P 500 greater than 12-month moving average
Position size: 10% of available equity
Commission: $0.01/share
All trades are executed at the open of next bar
Backtest range: 01/03/2000 – 11/22/2019
Case 1: Consider only current index constituents
Below is the equity curve of the strategy with the drawdown profile.
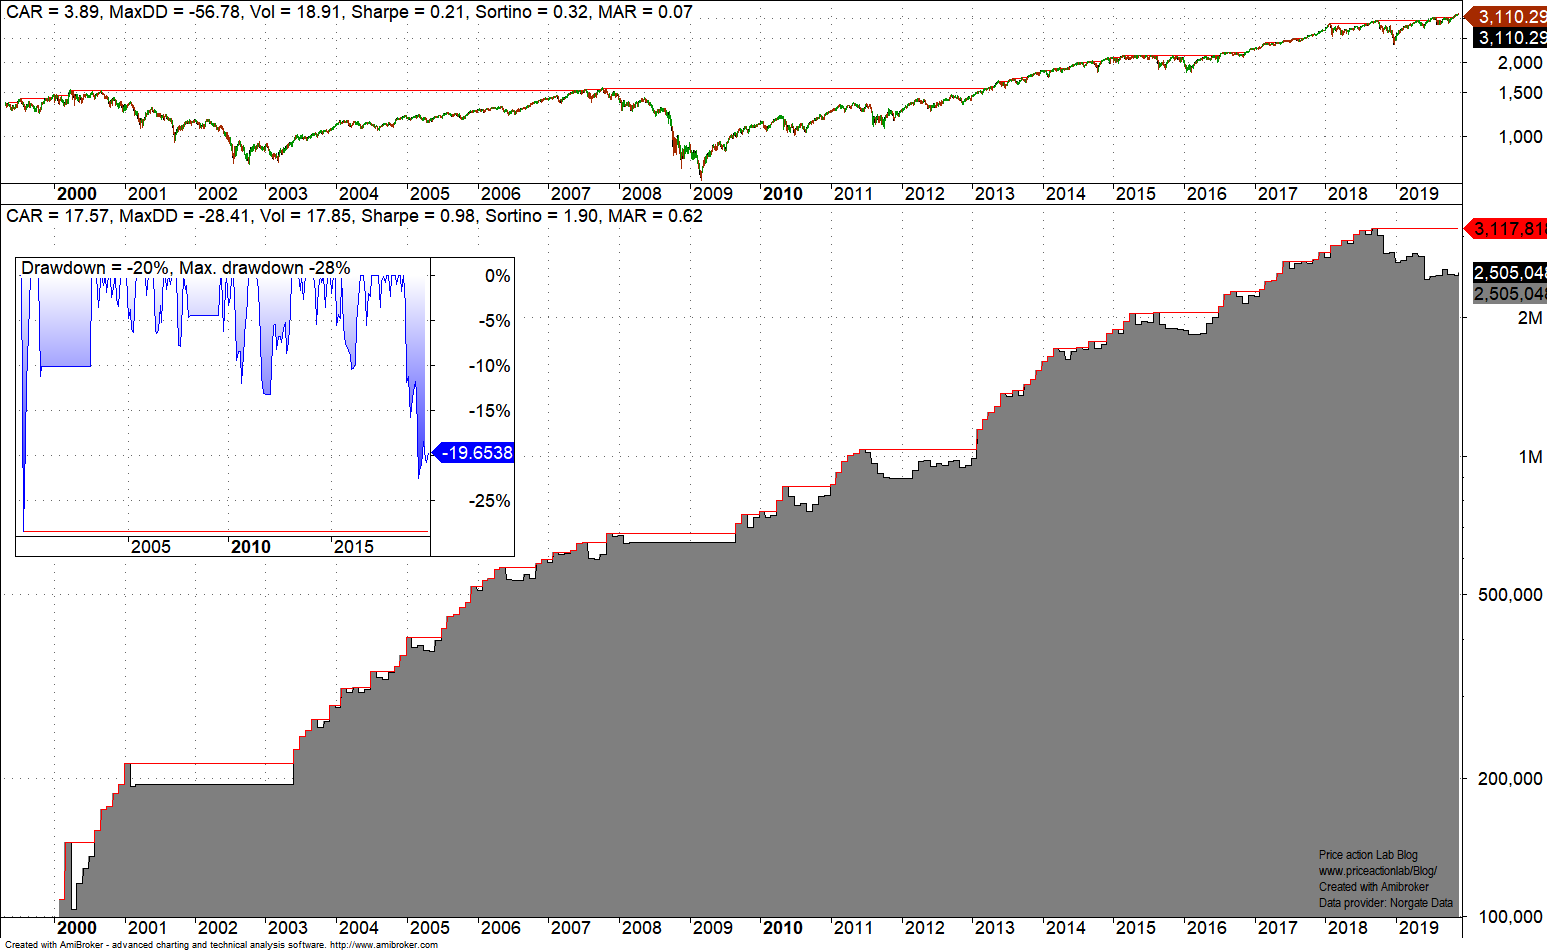
The backtest results look impressive but they are bogus. The impressive 17.6% CAGR and nearly 100% gain in 2000 are only due to survivorship bias. Despite that (we remove the bias below), it may be seen that after September 2018, the strategy has generated about 20% drawdown. Is this related to volume significance?
We will attempt to answer this question by replacing volume monthly change by monthly change in return as the strategy rank. The results are shown below.

Although CAGR increased by less than 1%, the maximum drawdown in the last two years increased significantly to nearly 38%. Therefore, buying stocks with larger monthly volume changes than those with larger monthly gains appears to be a better choice in last two years for this strategy. I was surprised by these results but let us see below how they change if we remove survivorship bias due to S&P 500 index rebalancing.
Case 2: Consider past and current index constituents
Below is the equity curve of the original strategy with the drawdown profile.

CAGR drops from 17.6% in the original backtest to a little more than 6% while the bogus 2000 return vanishes! Drawdown in last two years stayed at about the same levels since survivorship bias is small. Still performance is better than S&P 500 buy and hold before dividends for the backtest period.
Next, we replace volume monthly change by monthly change in return as the strategy rank. The results are shown below.

Despite the rise in CAGR, maximum drawdown increased significantly both recently and also in 2015 – 2016 period.
The conclusion from the strategy discussed in this article is that using monthly volume changes for ranking securities may provide a better indicator of momentum than when using the monthly return, which is by the way one measure of momentum. But this article cannot provide any general rules or conclusions but only one example. One could possibly find examples where use of volume causes performance deterioration. Trading and trading strategy development are complex subjects and general rules are not possible due to this high complexity.
Charting and backtesting program: Amibroker
Data provider: Norgate Data
Technical and quantitative analysis of major stock indexes and 34 popular ETFs are included in our Weekly Premium Reports. Market signals for position traders are offered by our premium Market Signals service
If you found this article interesting, you may follow this blog via RSS or Email, or in Twitter


