


The rebound in stocks after the March 2009 bottom will be entering its twelfth year soon. Fundamentals and technicals have disappointed bears in forecasting major tops, and some have turned to idiosyncratic methods, including astrology. A new “Puetz window” presents an opportunity, according to some.
I specifically wrote about a rebound because there is a misconception among many analysts that the bull market started in 2009. As I wrote in July 2016, the bull market started in 2013.
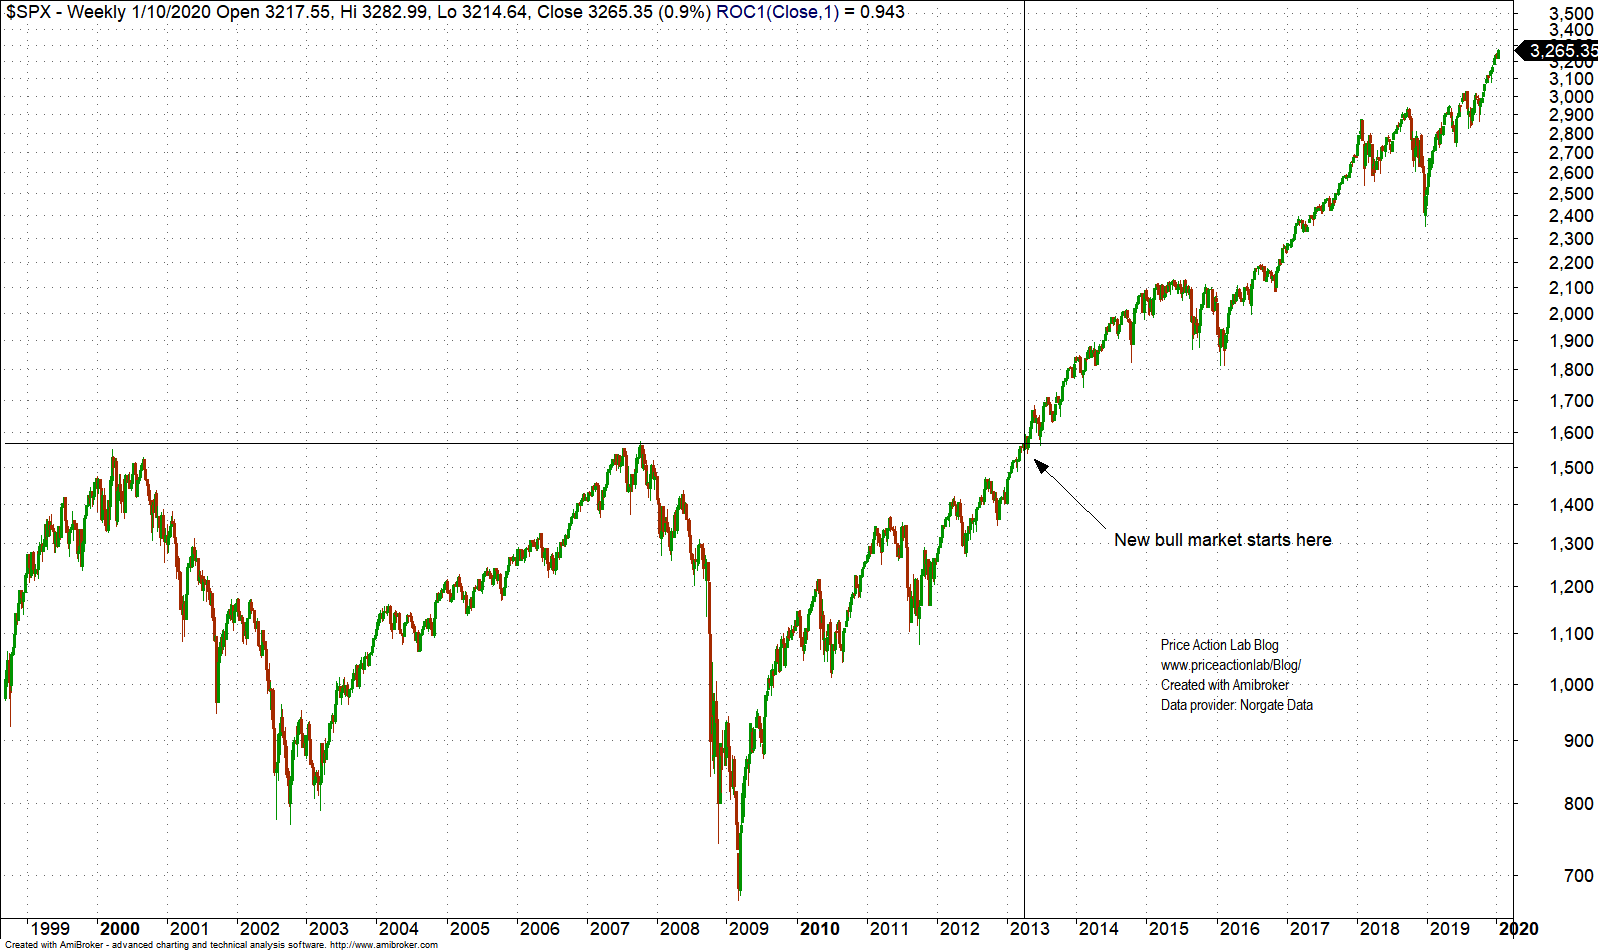
The bull market is actually in its eighth year, although the rebound started nearly 12 years ago.
Nothing has worked in the last seven years, technical or fundamental. There is hope now because of a “Puetz window.” What is that?
Steve Puetz has studied market cycles. Among his interesting works is the analysis of cycles triggered by lunar and solar eclipses. The “Puetz window” opens after the first full moon following a solar eclipse when there is also a lunar eclipse. Does this sound complicated? Here is a chart for the 1987 crash.

After a solar eclipse, there was a full moon and a lunar eclipse. Then the market crashed. Here is what I believe is the case:
Access the full report with a Premium Articles or All-in-One subscription. By subscribing, you have immediate access to hundreds of articles.
|
This post is for paid subscribers
Already a subscriber? Sign in |
Premium Content
Market analysis based on 30 years of skin-in-the-game
By subscribing, you have immediate access to hundreds of articles. Premium Articles subscribers have immediate access to more than two hundred articles, and All in One subscribers have access to all premium articles, books, premium insights, and market signal content.
Disclaimer: No part of the analysis in this blog constitutes a trade recommendation. The past performance of any trading system or methodology is not necessarily indicative of future results. Read the full disclaimer here.
Charting and backtesting program: Amibroker. Data provider: Norgate Data
If you found this article interesting, you may follow this blog via RSS, Email, or X.


