


Using smooth features to limit the impact of outliers can potentially result in smoother equity performance of equity long/short and also directional strategies.
We have tested a new option in DLPAL LS software that limits the impact of outliers by smoothing features with a non-linear operator. This option will be available in version 6 release. Below are examples of equity performance in daily timeframe using two strategies: ranking and directional bias system. We also tested weekly features and obtained similar results.
Daily ranking:
We use the product of two features generated by DLPAL LS, Pdelta and S, to rank securities and then select up to three top for long and up to three bottom for short.
Rank = Pdelta × S
Note that this strategy generates more than twice the number of trades of the directional bias strategy below due to continuous rebalancing.
Directional bias strategy
We select a maximum of six stocks according to the following criteria:
Buy/Cover if Pdelta × S > 0
Short/Sell if Pdelta × S < 0
Score = Pdelta × S
The score function is used to resolve any ties. Note that with this strategy, entry signals wait for exit signals and therefore the number of trades is lower than when using daily ranking.
Backtest Results
For the tests we used a random number generator to select 20 stocks from S&P 100 index and then generated normal and smoothed features with DLPAL LS from 01/03/2000 to 12/31/2007. Below are the results of the two strategies that include commission from 01/03/2008 to 02/14/2020.
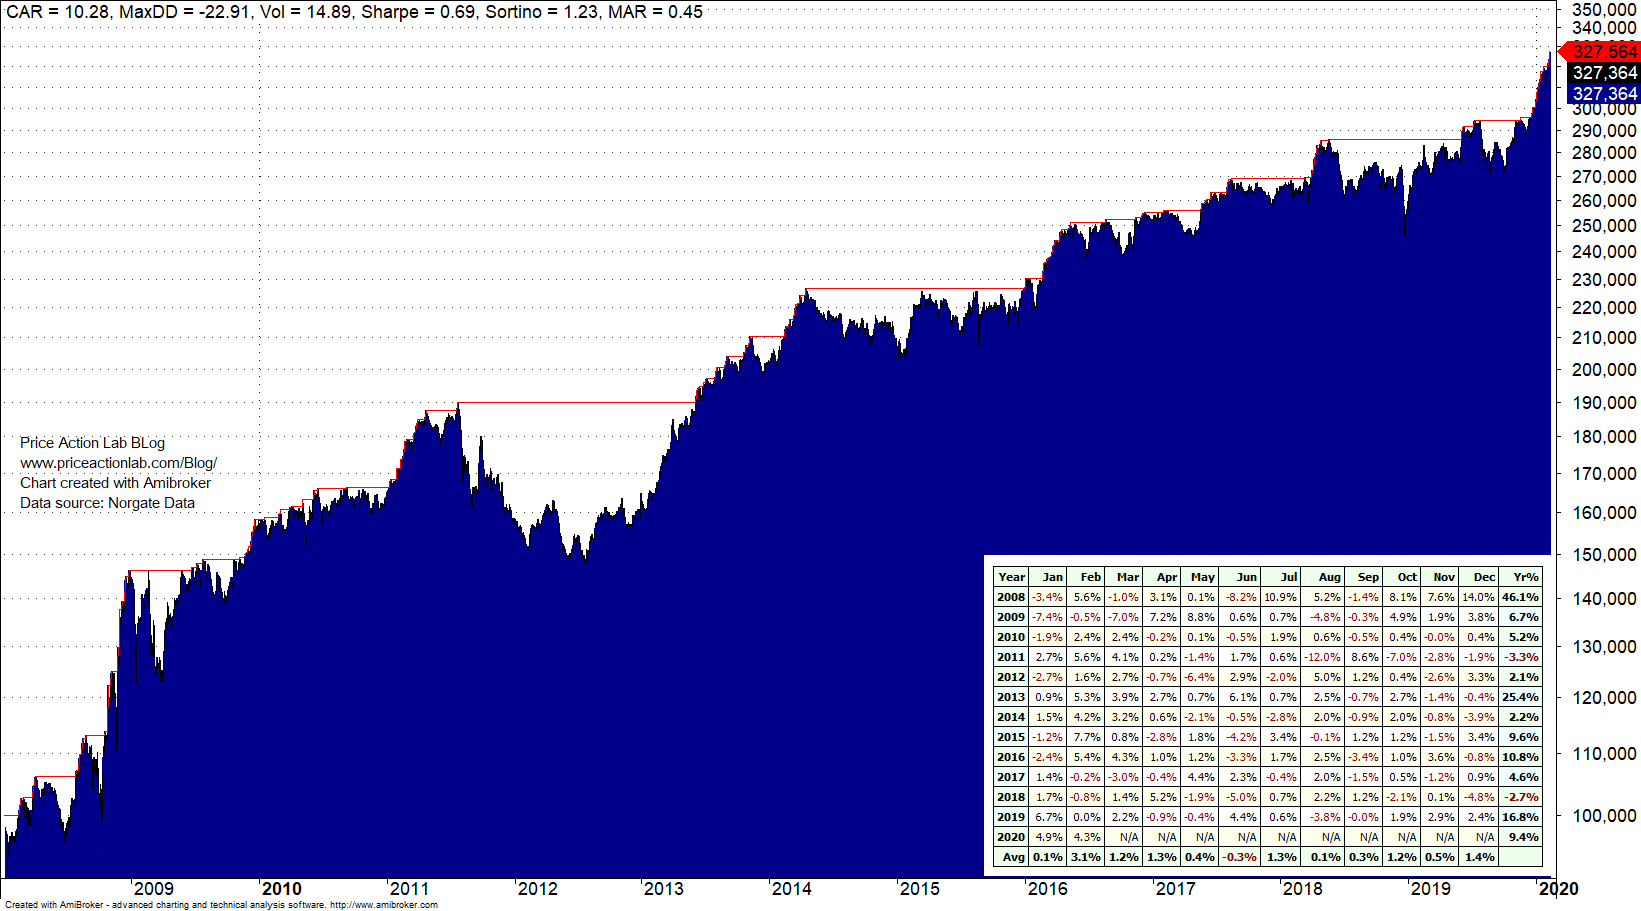
Ranking strategy equity curve and monthly returns with normal features.
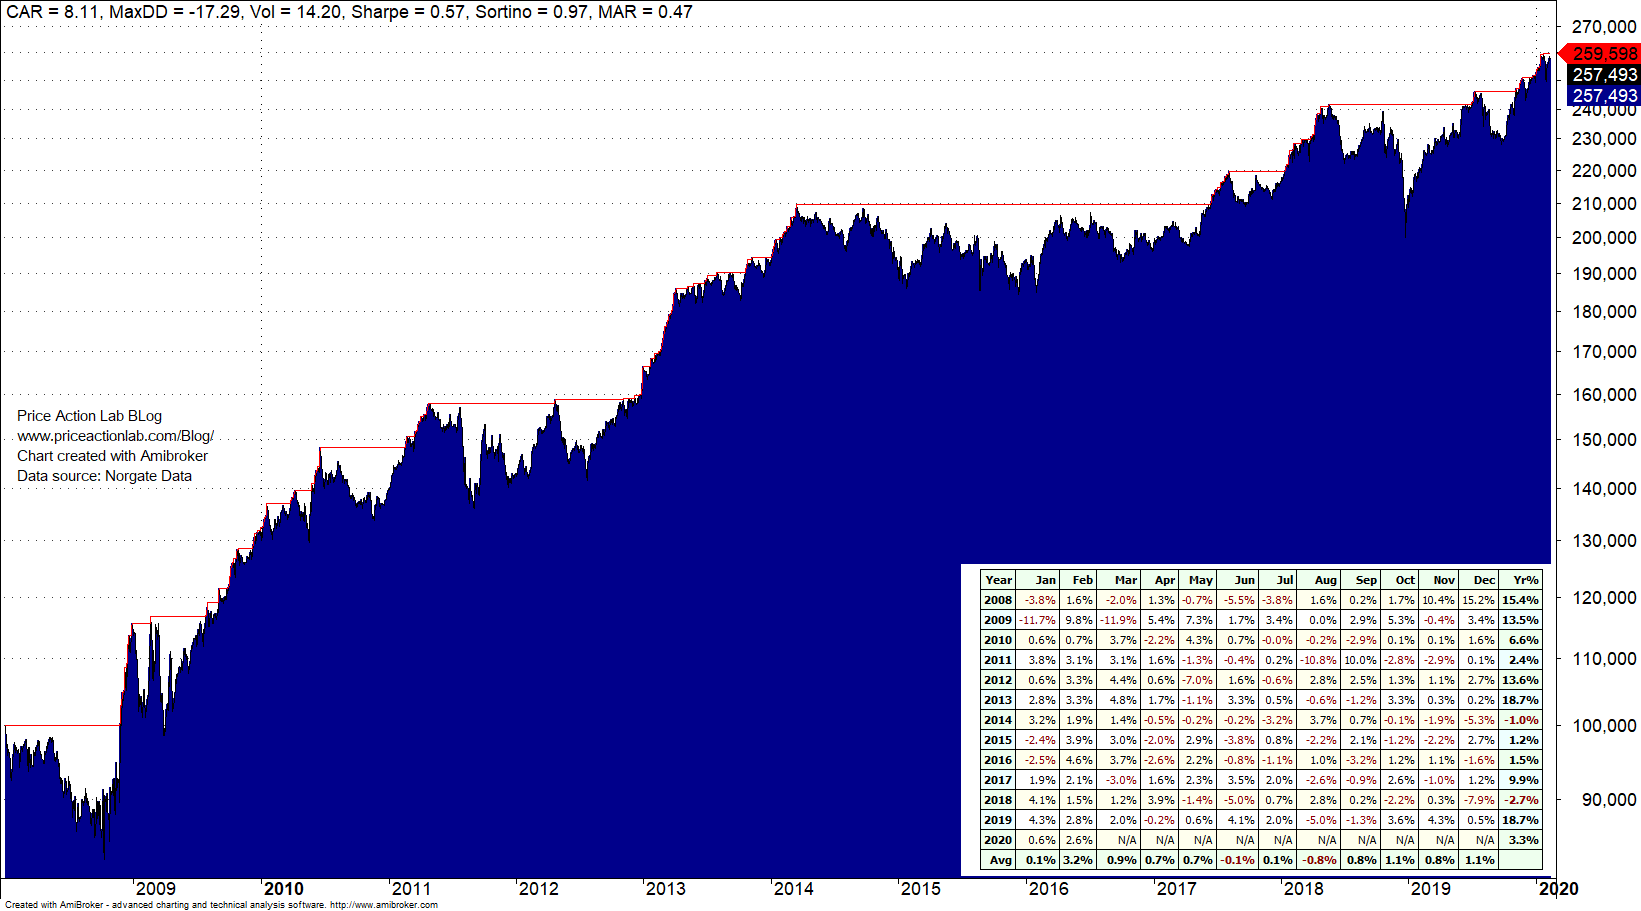
Ranking strategy equity curve and monthly returns with smoothed features.
Performance is summarized in the table below.
| Parameter | Normal features | Smoothed features |
| CAGR | 10.3% | 8.1% |
| Max. DD | -22.9% | -17.3% |
| Sharpe | 0.69 | 0.57 |
| Win Rate | 52.5% | 51.5% |
| All Trades | 12207 | 13355 |
| Long Trades | 7803 | 8936 |
| Short Trades | 4404 | 4899 |
Maximum drawdown was reduced by 25% with the smooth features with a simultaneous 21% reduction in CAGR. The equity curve shows smoother performance but at the penalty of lower returns. These are good results because they show that normal features performed well in maximizing returns as designed originally. Smooth features have the potential of reducing maximum drawdown by removing outliers that generate large positive but also large negative returns.
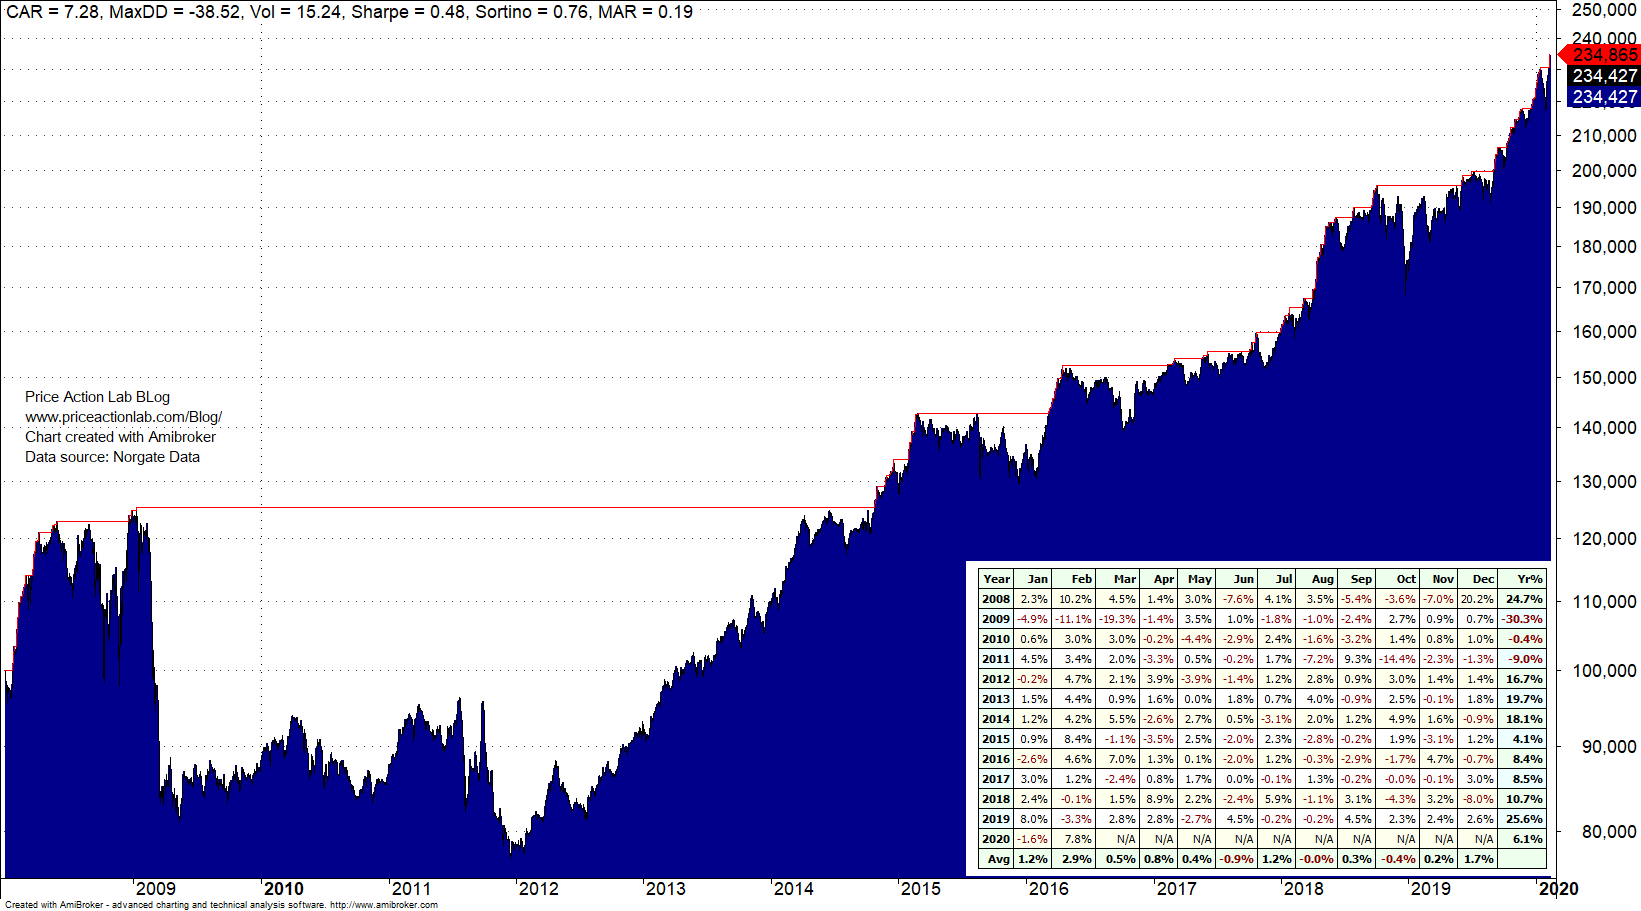
Directional bias strategy equity curve and monthly returns with normal features.
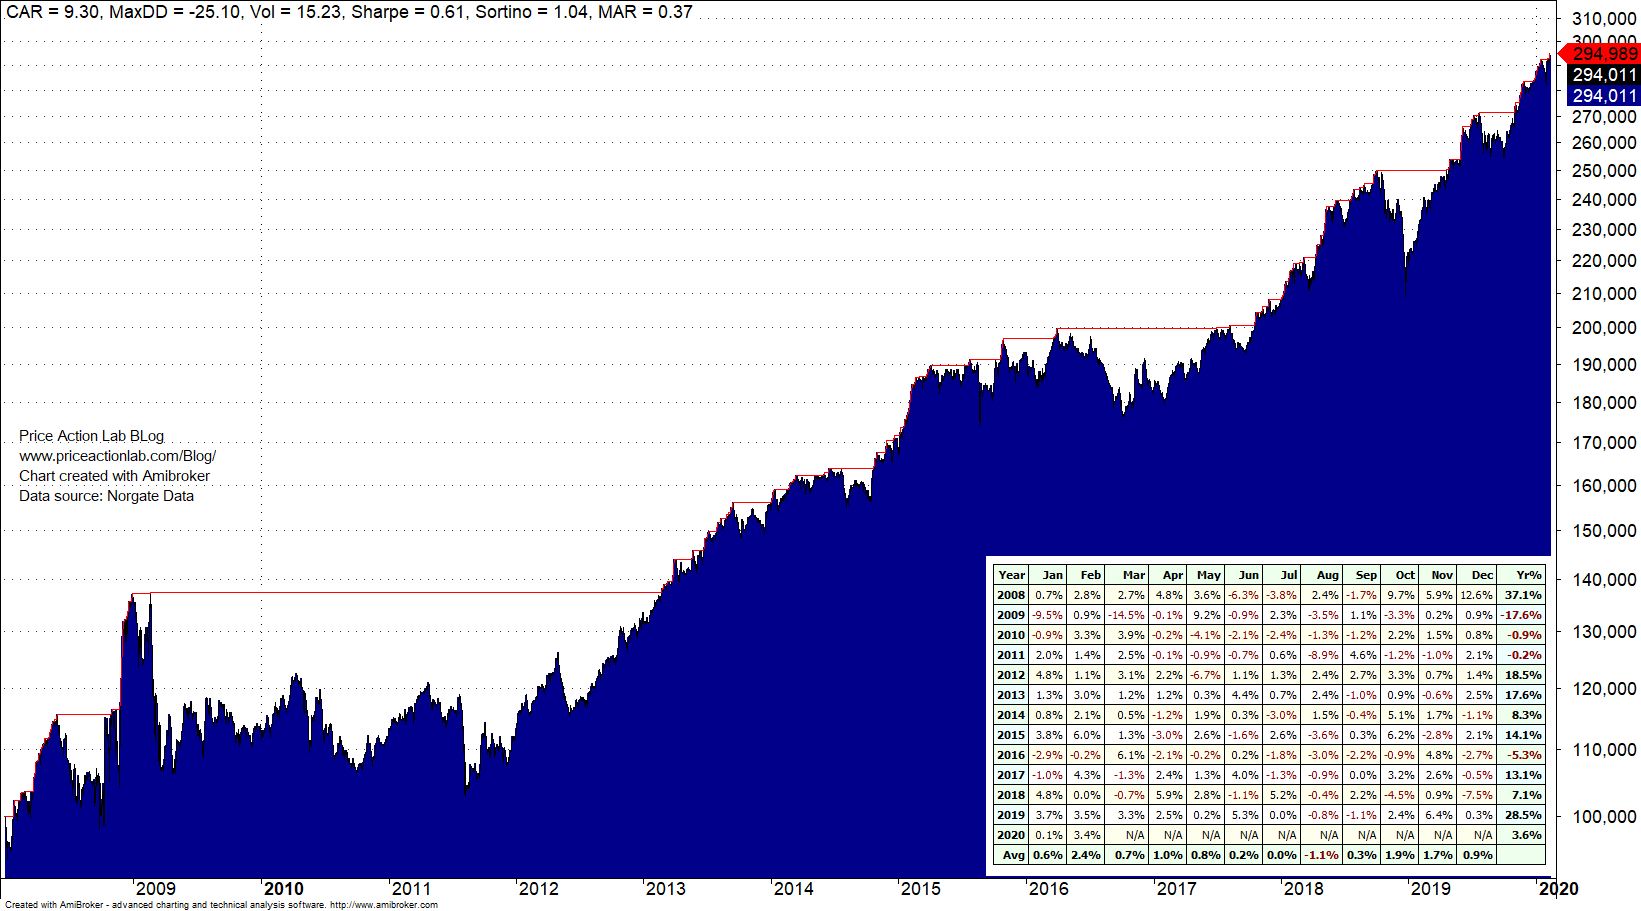
Directional bias strategy equity curve and monthly returns with smoothed features.
Performance is summarized in the table below.
| Parameter | Normal features | Smoothed features |
| CAGR | 7.3% | 9.3% |
| Max. DD | -38.5% | -25.1% |
| Sharpe | 0.48 | 0.61 |
| Win Rate | 54.8% | 53.5% |
| All Trades | 5547 | 6216 |
| Long Trades | 3534 | 3915 |
| Short Trades | 2013 | 2301 |
In this case CAGR is higher and maximum drawdown is lower in the case of smoothed features. Using the new option for smooth feature generation may result in smother performance with some directional bias strategies and at higher returns.
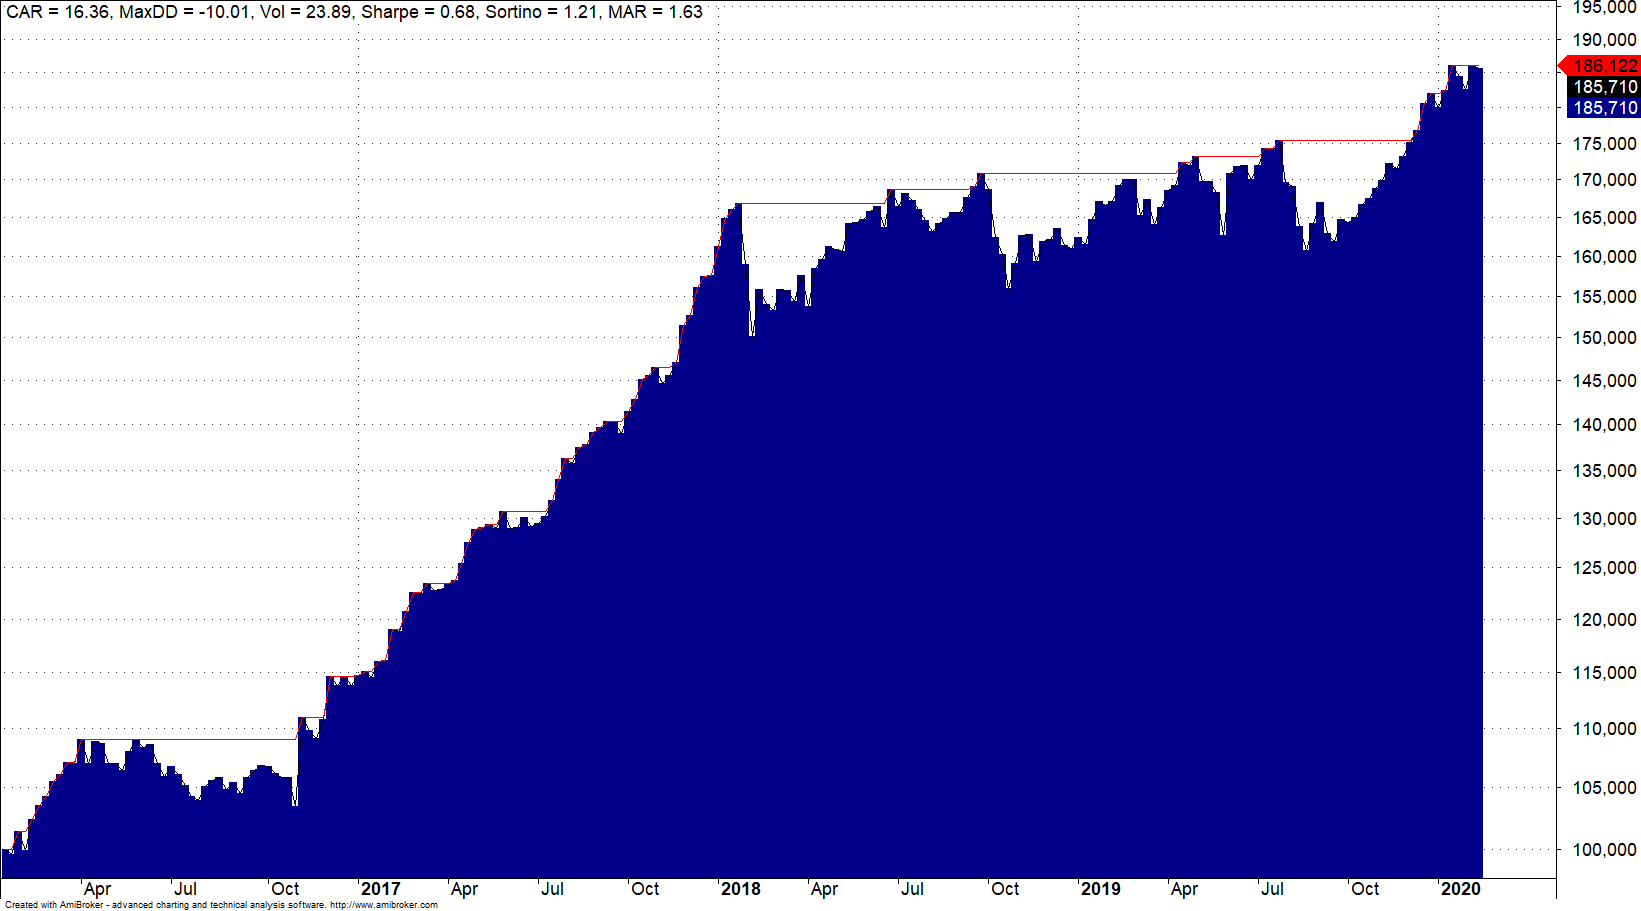
Note that securities for the portfolio were selected at random only once and not based on some criteria.There were no repetitions until results were received that confirm the hypotheses, as it is usually done in some academic papers. We also obtained similar results with weekly features. For example, below is the performance of a directional bias strategy for Dow 30 stocks with normal features.
Below is the same strategy with smoothed features.
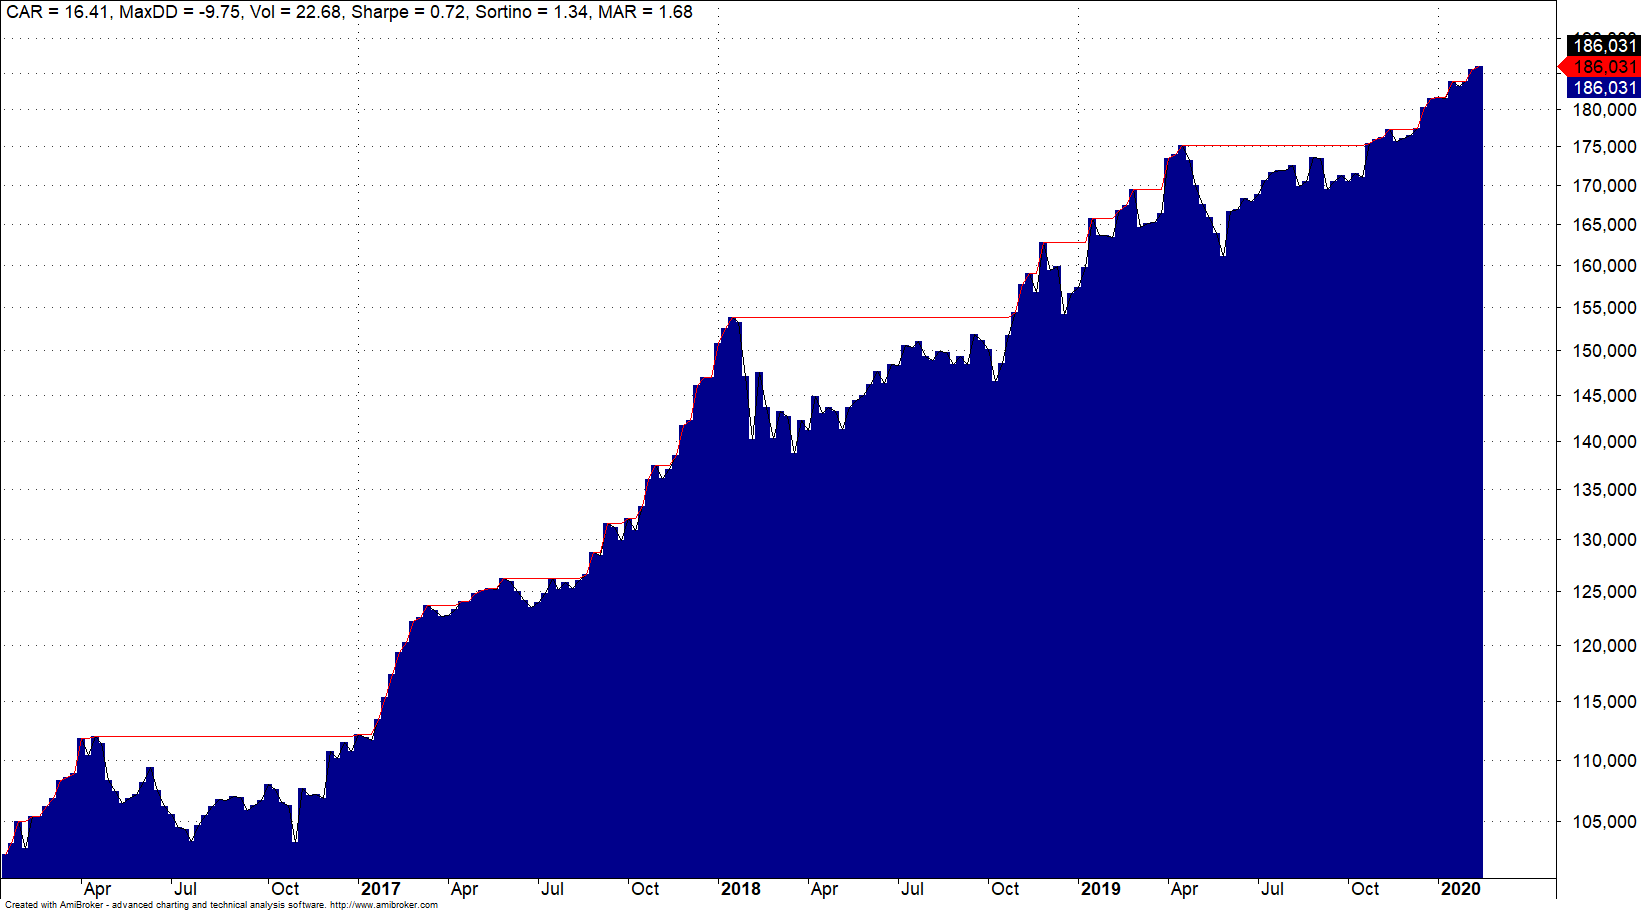
It may be seen that smoothed weekly features result in smoother equity performance.
Conclusion
Smoothed features have the potential of generating smoother returns but at the same time they did not invalidate the potential of normal features. This new option for feature generation and updating will be available in DLPAL LS v6 when it is released.
A different way of developing trading strategies
DLPAL LS offers a different way of developing trading strategies that does not rely on traditional indicators. This software is used by fund managers around the world to develop long-short but also directional strategies in a variety of markets.
More details about DLPAL LS can be found here. For more articles about DLPAL LS click here.
If you have any questions or comments, happy to connect on Twitter: @priceactionlab
Strategy performance results are hypothetical. Please read the Disclaimer and Terms and Conditions.


