

There is a gap between what academics look for in market analysis and what practitioners want but this has been underestimated or even undermined.
The academic often looks at the results of some mathematical operations and determines if the effect they describe is (statistically) significant. Usually this is done on occasions in an overly complex way to attribute authority to the results and pass peer-review.
For example, let us consider a simple momentum strategy that buys the top 10 S&P 500 stocks when the 252-day rate-of-change is positive and sells the stocks with negative 252-day rate of change. The score to select the stocks is the relative 252-day rate of change rank.
For the backtests in this article we used Norgate data. For the S&P 500 index the data include current and past constituents to remove survivorship bias. We highly recommend this data service to those who would like to remove survivoship bias from backtests (we do not have a referral arrangement with the company.)

| Strategy | Buy and hold |
| 9.9% | 7.1% |
The academic concludes that the strategy offers outperformance over buy and hold. There is a “momentum” anomaly with a significant effect.
The practitioner world is quite different. In that world there are real money at risk, customer anger, withdrawals in case of large losses and a host of other parameters to consider, including liquidity, capacity limitations etc.
The practitioner backtests the idea and this is the result in the period considered with delistings taken into account.
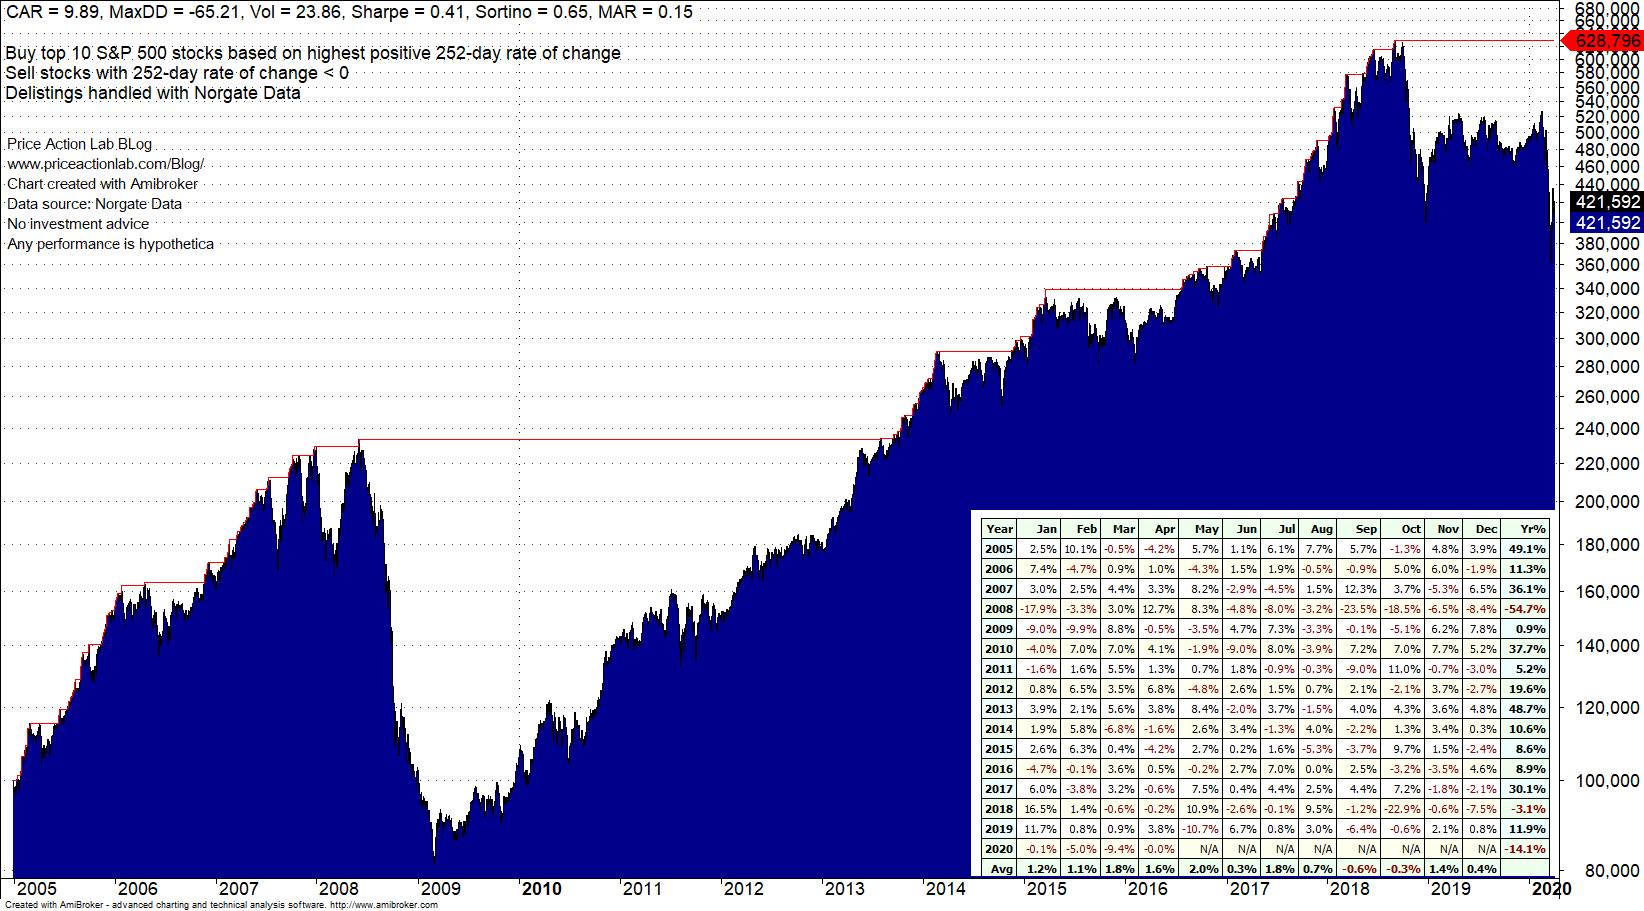
Now, no sane practitioner would ever consider this strategy although in aggregate terms there does seem to be outperformance. This strategy lost more than 54% in 2008, i.e., it did no better than the market. Year-to-date, the strategy is down 14.1%.
Actually, the huge drawdown of the strategy is the “academic gap.” Why are equity curves so rare in academic papers? To start with, the academic tries to take distance from practitioners to appear more advanced. Then, the academic does not intend to use the idea to trade or manage money; this is the “problem” of the practitioner.
Practitioner hindsight
Here is where practitioner hindsight comes into the picture. The outperformance of the original strategy is evident and the practitioner plays with a backtesting program by adding some filters in an attempt to minimize the impact of the 2008 bear market. The naive approach is to execute the strategy only when the S&P 500 is above the 200-day moving average. Here is the backtest with the bear market filter added.
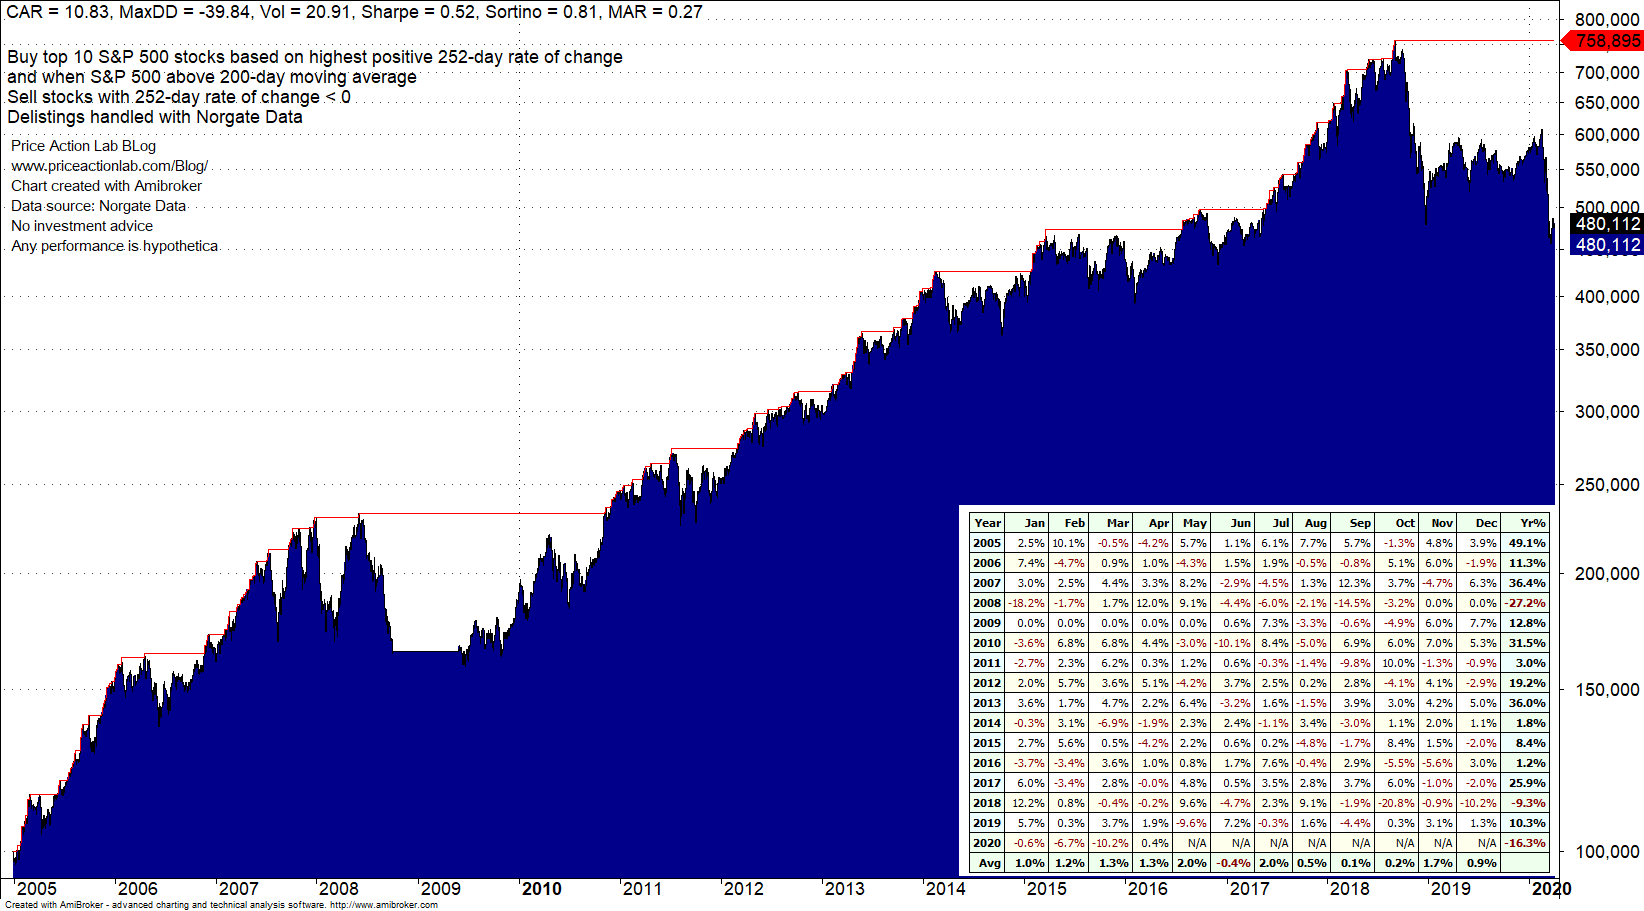
Success! At least it looked that way before 2019 and the current crisis. Maximum drawdown is reduced significantly along with 2008 losses while CAGR increases to 10.8% from 9.9%. “This is the real thing” the practitioner with the backtesting toy things.
However, notice that year-to-date losses increased to 16.3% from 14.1%. In general, even with hindsight, something has to give in the past, and worse, in the future. In fact, this strategy hasn’t been working well since 2019.
Here comes another practitioner in hindsight and adds another filter to reduce 2020 losses: in addition to not taking any new positions, also exit open positions if the S&P 500 falls below the 200-day moving average.
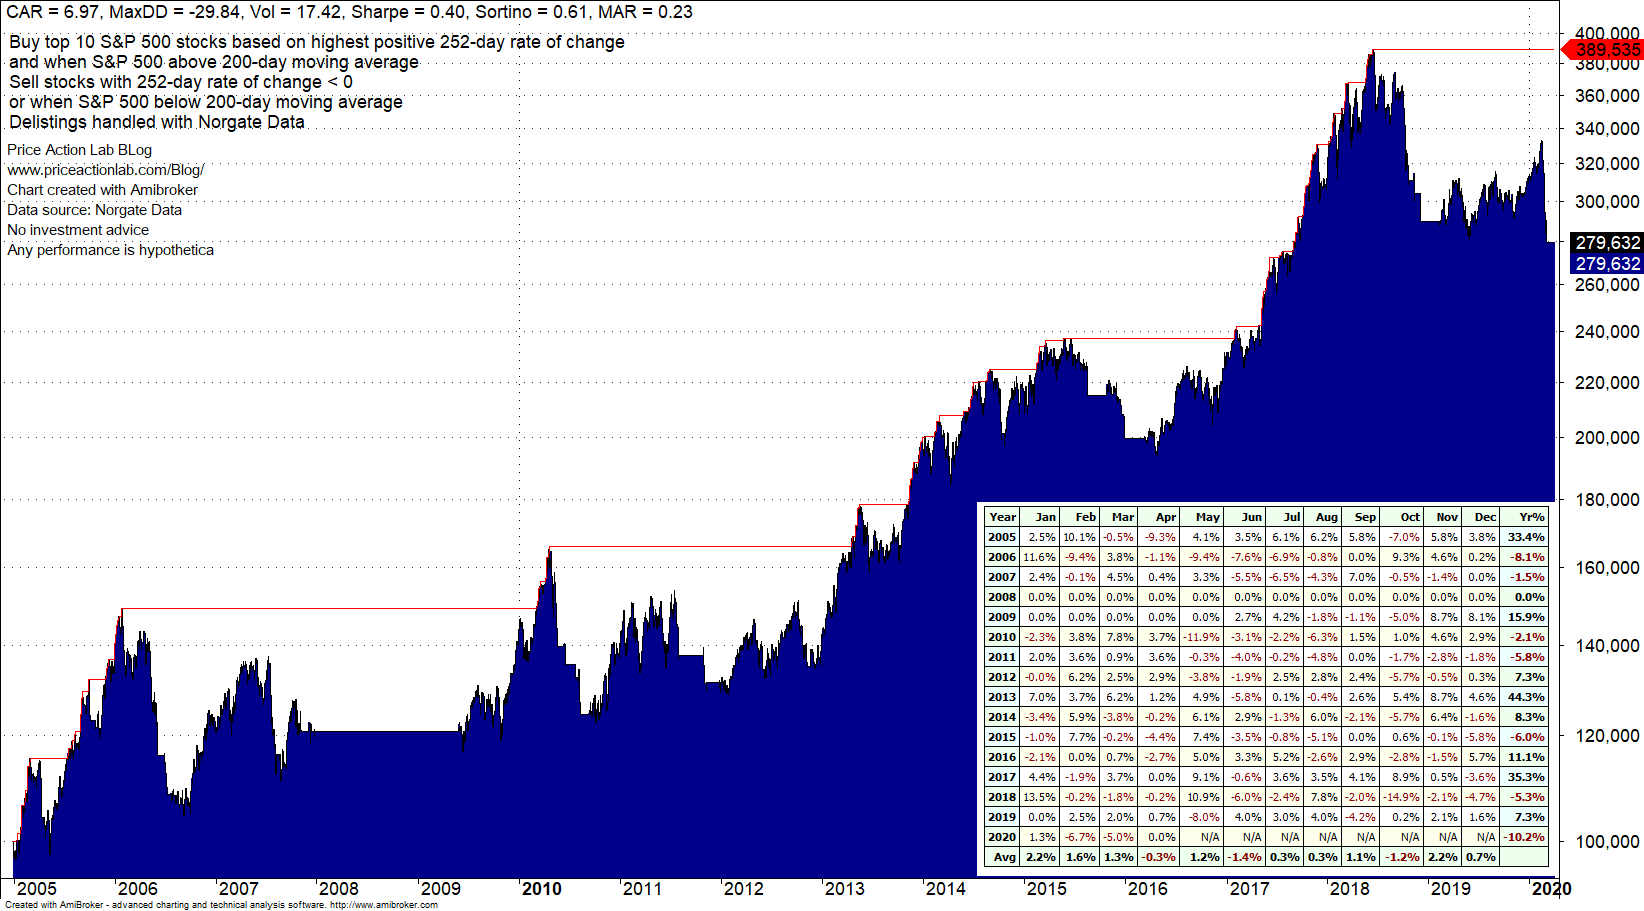
So now 2020 looks better at -10.2% year-to-date but the question is as follows: would you have considered this strategy in the first place? CAGR is at buy and hold levels after the two filter additions and the strategy only offers better maximum drawdown. This strategy does not have the equity curve serious practitioner like.
Can the strategy be fixed? Probably not since it is inherently unstable and risky. So why are academics impressed by the outperformance of the original version without any filters? This is because academics have different objectives than traders and money managers; the latter have many more constraints .
In my opinion and experience, many misunderstand the nature of involvement of academics with the markets. If you expect academics to offer you a strategy to make money, you probably do not understand the gap between them and practitioners.
Obviously, the examples in this brief article cannot be generalized and there are exceptions. In trading strategy development there are no general rules. But the major trade-offs are well-known to most advanced practitioners along with the impact of data-mining -bias and multiple comparisons on strategy significance.
Charting and backtesting program: Amibroker
Data provider: Norgate Data
If you found this article interesting, you may follow this blog via RSS or Email, or in Twitter

Price Action Lab Blog Premium Content


