


The speed and magnitude of recovery of trading strategies may reveal whether their edge is structural or random. As an example, we compare the performance of four mean-reversion strategies year-to-date.
Four mean-reversion strategies in daily timeframe are listed below.
| Rules | Name |
| Long: RSI(2) < 10 Exit: RSI(2) > 70 | RSI2 |
| Long : (C-L)/(H-L) < 0.2 Exit: (C-L)/(H-L) > 0.8 | IBS |
| Long: C < C[1] AND C[1] < C[2] Exit: C > C[1] AND C[1] > C[2] | WR2 |
| Long: PSI5* Exit: PSI5 | PSI5 |
*Proprietary mean-reversion algo. Click here for more details.
All entry and exit positions are for SPY ETF at the open of the next bar. Equity is fully invested and $0.01 commission per share is used in all backtests. Backtest period is from 01/02/2020 to 05/05/2020.
Backtest Results
| Strategy | Return | Max. Drawdown |
| PSI5 | +3.9% | -22.1% |
| RSI2 | -15.5% | -24.7% |
| IBS | -3.7% | -21.9% |
| WR2 | -7.6% | -30.6% |
Only the PSI5 strategy has nearly recovered from drawdown. The well-know RSI2 strategy shows the largest loss year-to-date. For more details about different parameter settings for RSI2 see this article. IBS has the smallest loss. The “naive” WR2 strategy is performing better than RSI2 year-to-date.
The main reason PSI5 has recovered is because this strategy is based on a formula from probability theory that describes price action dynamics. The strategy was not identified by analyzing price action, i.e., it was not suggested by the data but by theory. Not all strategies suggested by the data are bad but most are random. In general, it is very difficult to determine which strategies that are suggested by data are not random. The analysis required for that constitutes an edge in itself.
Below is the equity performance of PSI5 strategy year-to-date.
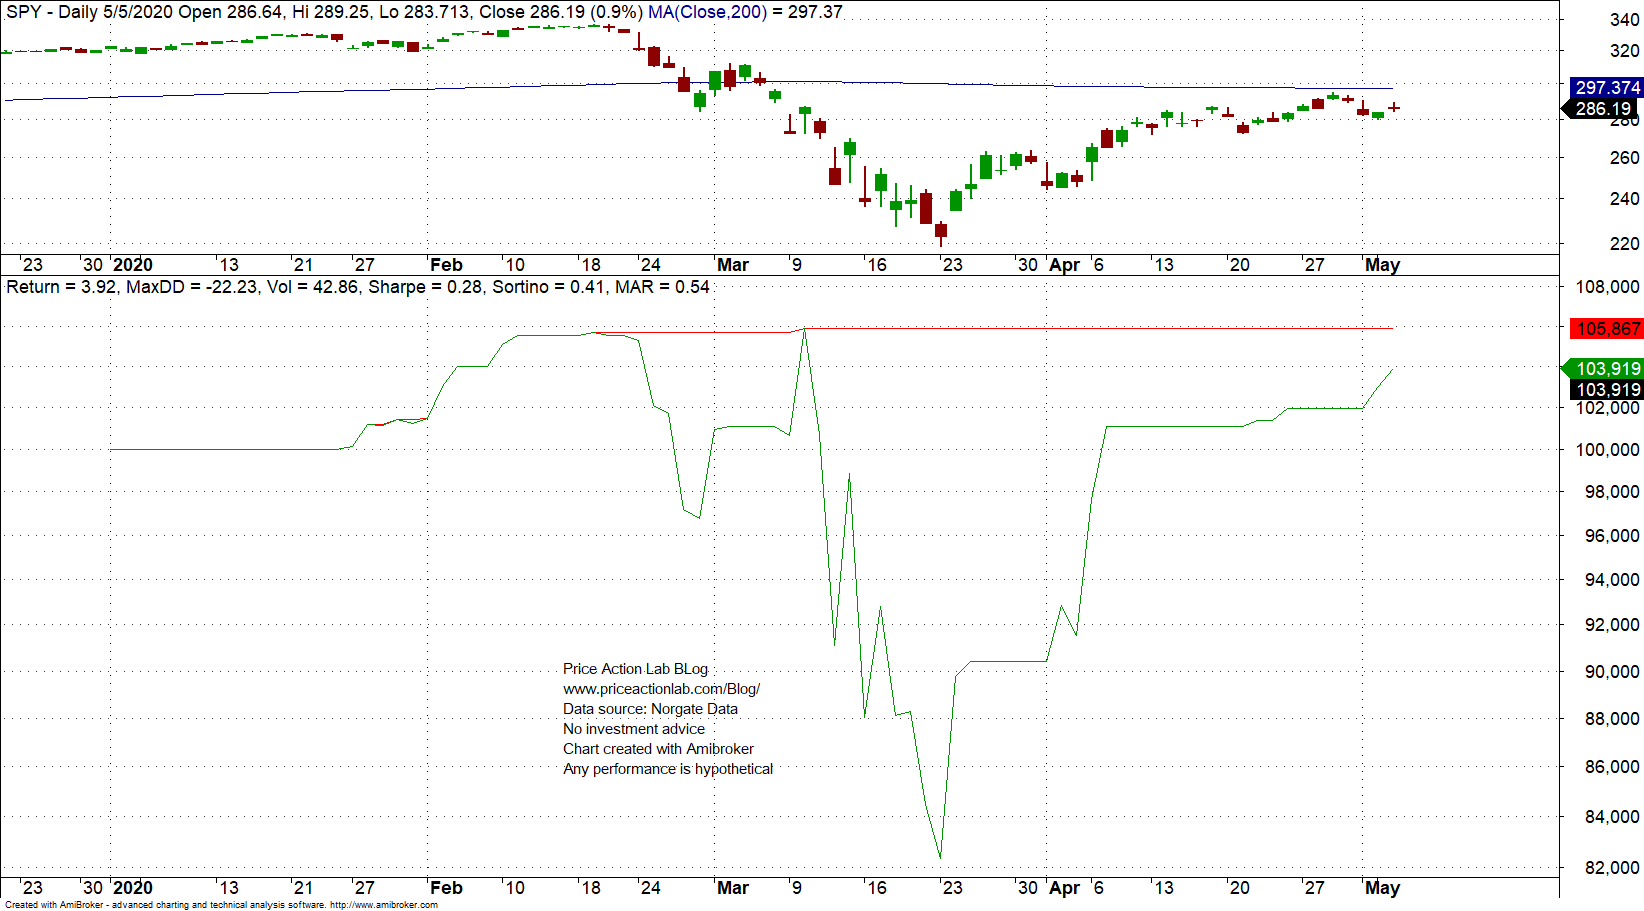
SPY ETF is down 10.5% year to date but the strategy is up +3.9%. This is significant performance given the speed of the market decline and subsequent rebound. The other three strategies have been unable to respond to fast price action dynamics. The speed of response and the magnitude are indications of whether the edge of a strategy is structural or random.
Charting and backtesting program: Amibroker
Data provider: Norgate Data
Technical and quantitative analysis of major stock indexes and 34 popular ETFs are included in our Weekly Premium Reports. Market signals for position traders are offered by our premium Market Signals service
If you found this article interesting, you may follow this blog via RSS or Email, or in Twitter


