


“Buying the dips” has just hit another record in NASDAQ-100 and a related ETF. Technically, this is the reason tech stocks have had a strong performance year-to-date.
The percentage of down NASDAQ-100 days that are followed by up days in a 252-day period made a new all-time high at 71% this week. The previous high was on May 15, 2017, at 67.3%
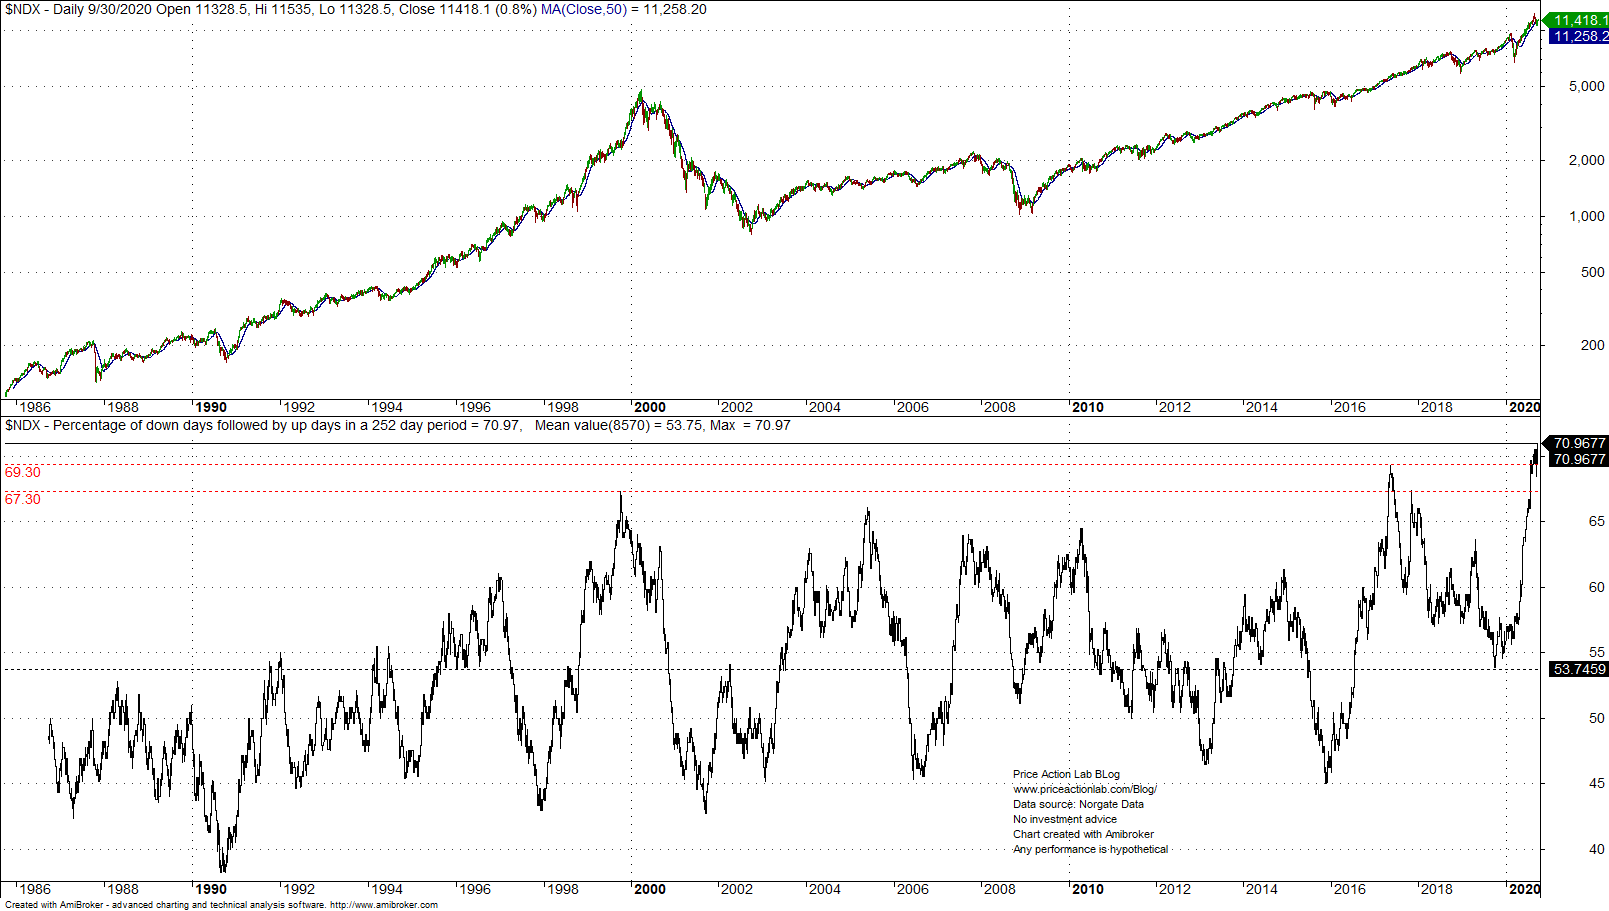
Note that before the last exponential rise of the dot com rally in the 90s, the percentage of down days followed by up days in a 252-day period had reached a high of 67.3%. Therefore, current levels of this indicator at 71% are extreme based on historical values.
A similar development may be seen in QQQ ETF below.
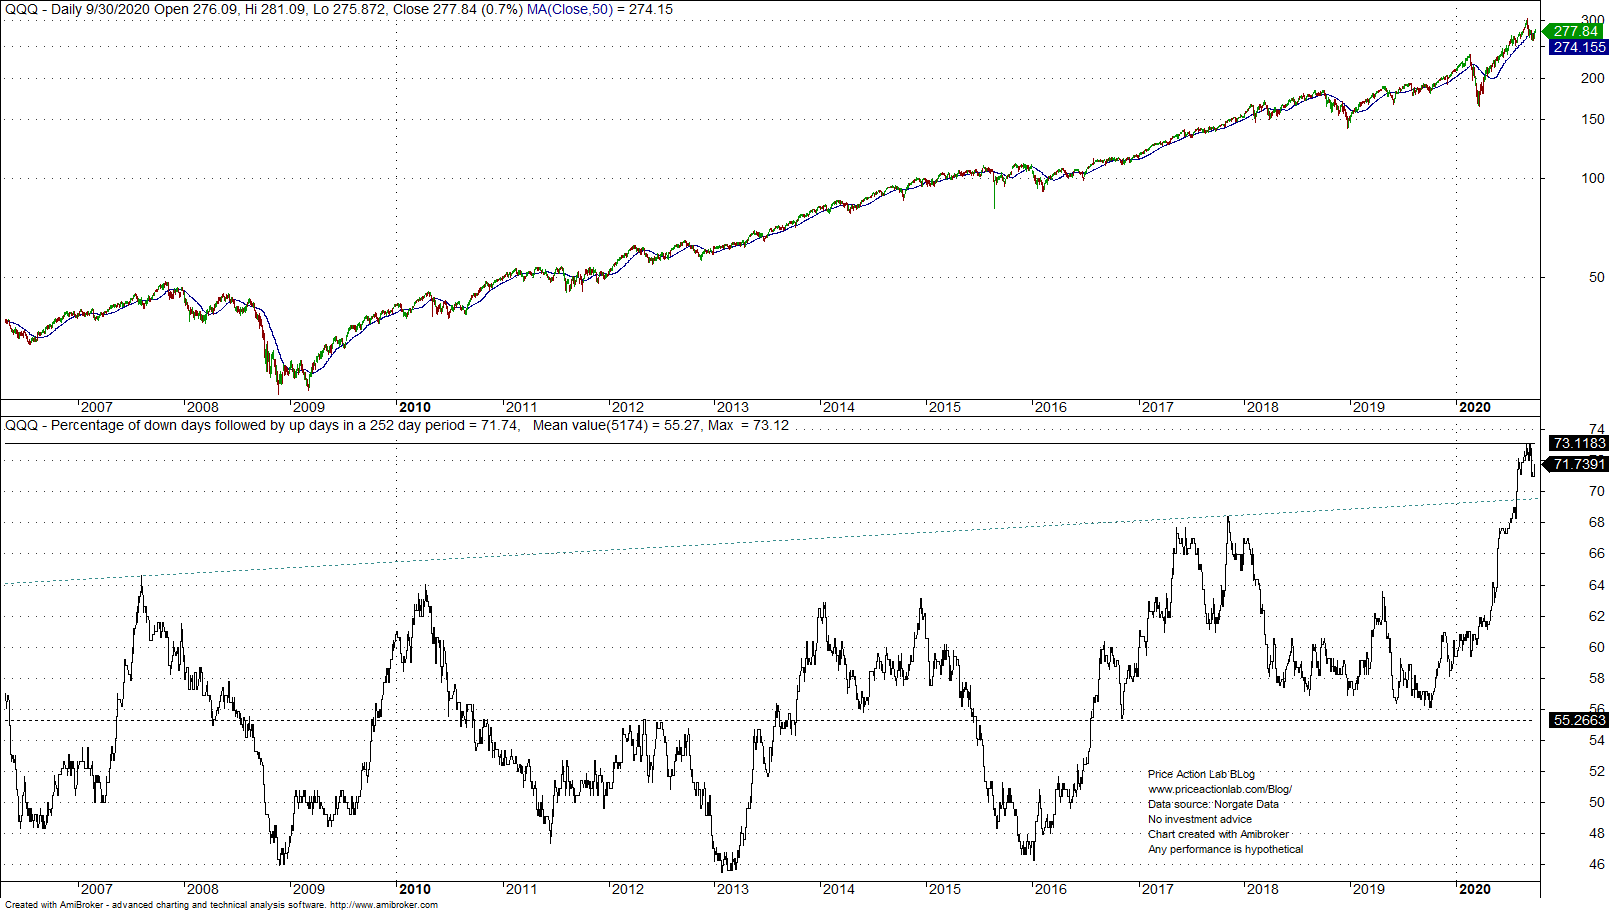
New high levels for the percentage of down days followed by up days in a 252-day period were reached thrice in September at 73.1%. The current reading is 71.7% and that is much higher than values realized in past bull markets.
The high percentage of down days followed by up days is the result of relentless dip buying and due to that there is an extreme mean reversion dynamic currently in the stock market. Usually, extreme conditions in the stock market end abruptly with a violent reversal of associated indicators but the timing of such events cannot be established in advance.
Charting and backtesting program: Amibroker
Data provider: Norgate Data
If you found this article interesting, you may follow this blog via push notifications, RSS or Email, or in Twitter

Price Action Lab Blog Premium Content


