


After the extreme momentum state of the 70s followed by a significant regime change in late 90s, the stock market has recently entered an extreme mean-reversion state. We also discuss possible ramifications from this development and the contribution of new traders and option buyers to stabilizing the market.
As shown in the daily S&P 500 chart below, the stock market reached extreme state of momentum in the 70s with the 1-lag, 252-day autocorrelation of daily returns reaching as highs as +0.45 during May 1971.
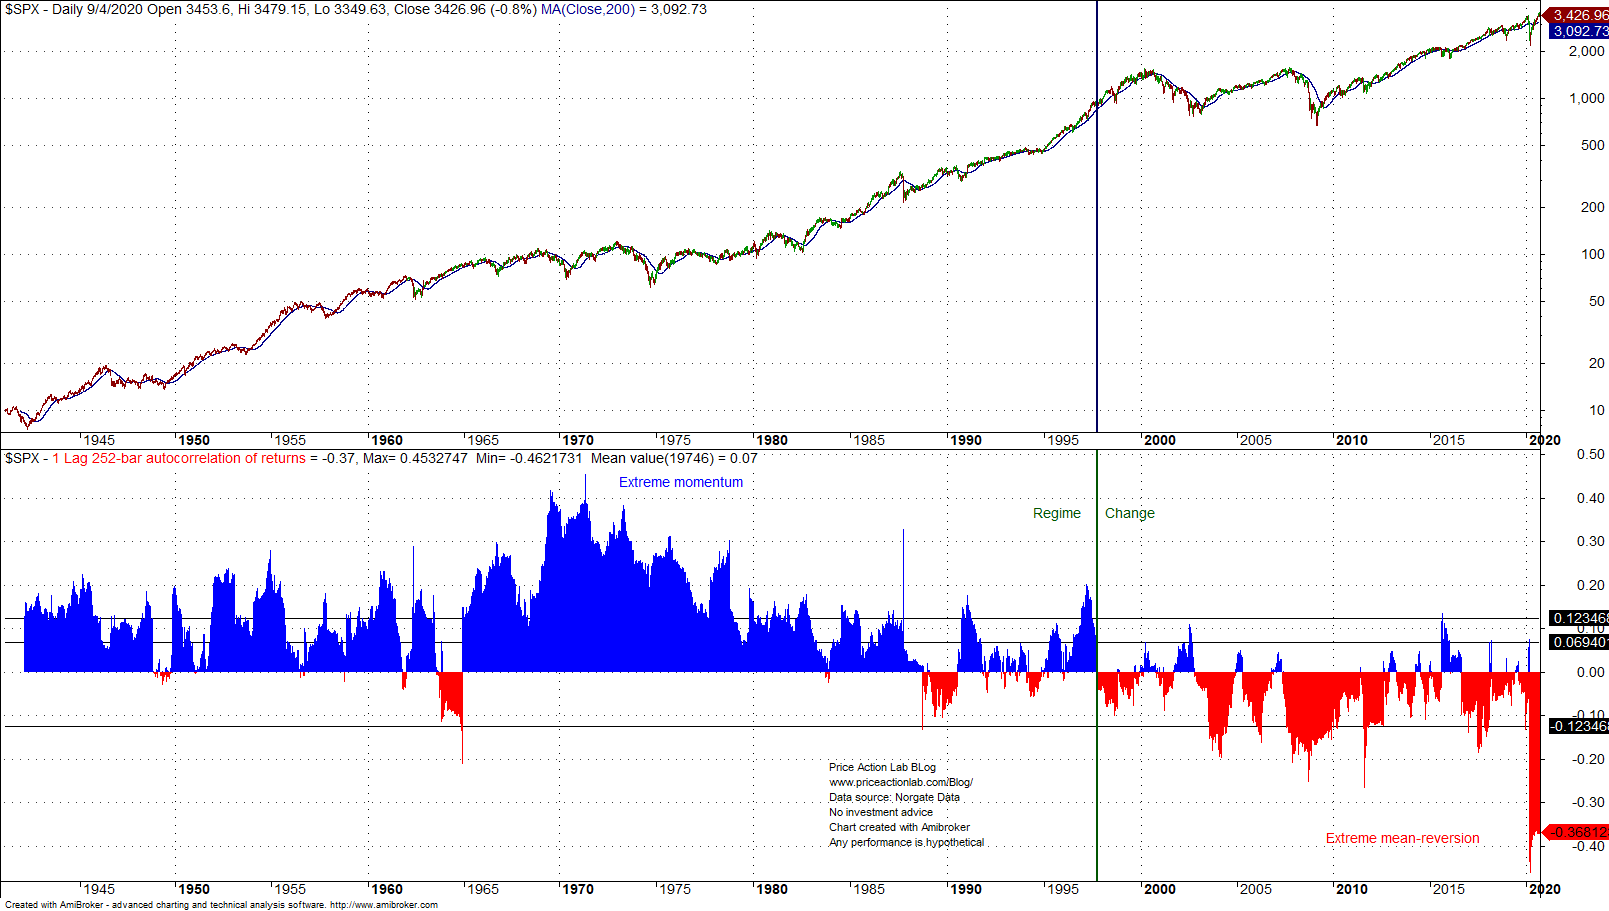
A regime change occurred in late 1997 and the 1-lag, 252-day autocorrelation of daily returns reversed and has stayed in negative territory since for the most part. This is the new mean-reversion regime. During the market crash earlier this year, this autocorrelation reached the extreme negative level of -0.46 and it is at -0.36 as of Friday, September 4, 2020.
Why do we call the two regimes momentum and mean-reversion? High positive autocorrelation means that there is higher probability that up(down) days will be followed by up(down) days and high negative autocorrelation means that there is higher probability up(down) days will be followed by down(up) days.
The autocorrelation regime change has been extensively covered in this blog in the last 10 years. See this article for example. We have also argued that the rise of classical technical analysis in the 1970s and 1980s was due to the fact that traders were fooled by strong momentum and attributed predictive power to random pattern formations. After the regime change in late 1990s, classical analysis stopped working as expected because markets were ruled by mean-reversion.
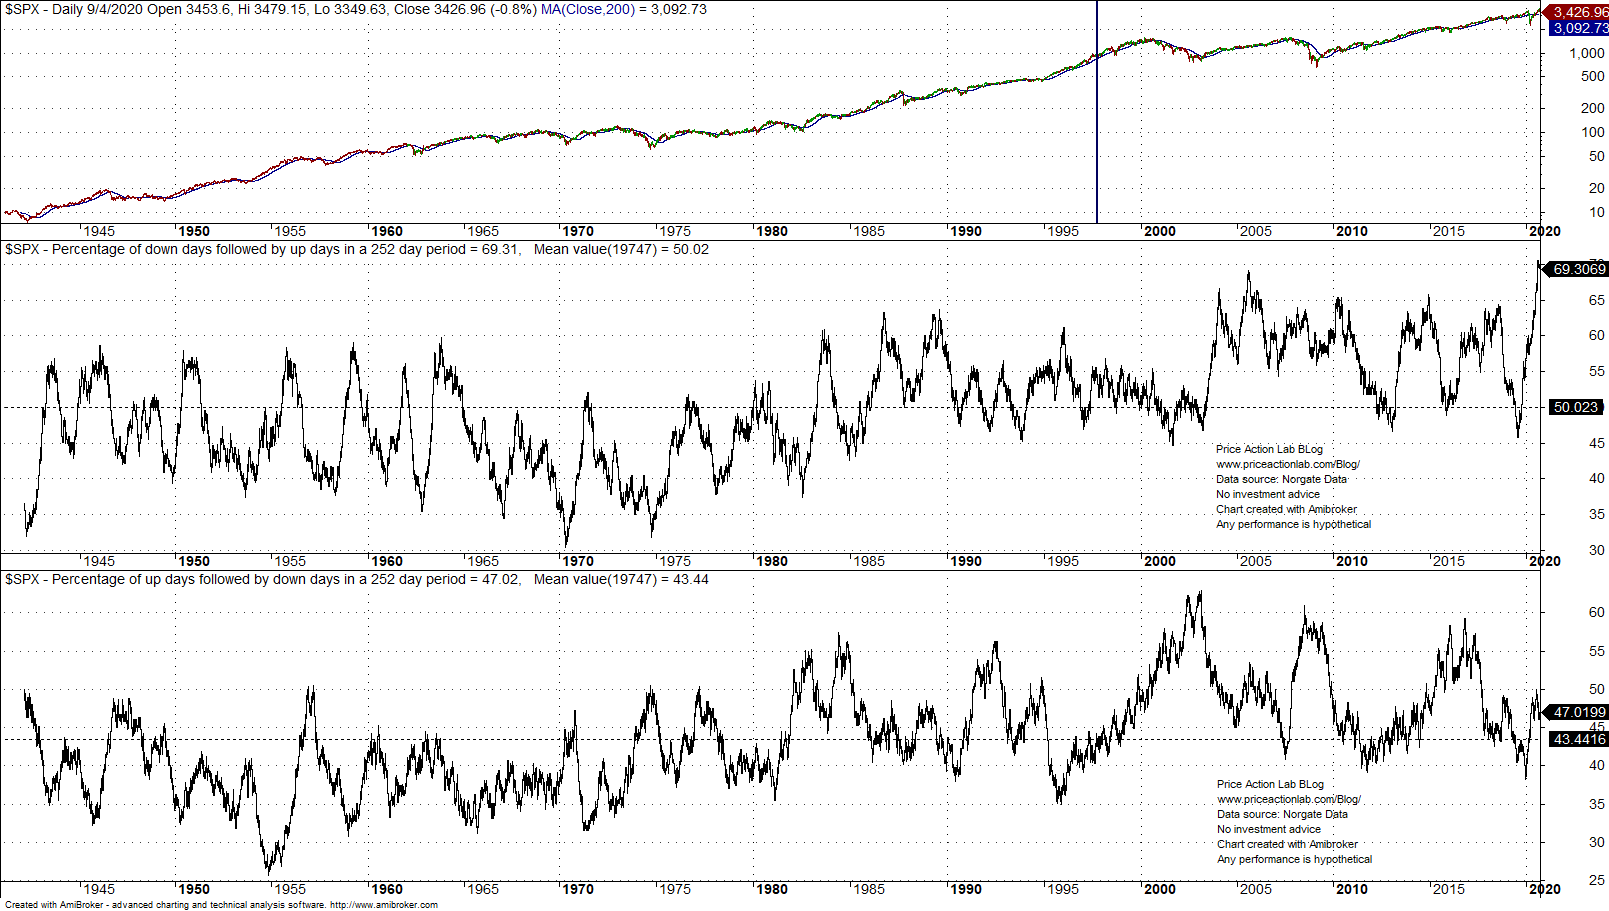
Stock indexes have been making new highs because primarily down days have been followed by up days in greater proportion than up days have been followed by down days.
As it may be seen from the chart below, the percentage of down days followed by up days in a rolling 252-day period recently reached an all-time high of 69.3% while the percentage of up days followed by down days is at 47.02% and much below the all-time highs.
The above analysis basically explains why the stock market keeps making new highs while in mean-reversion regime: there are market participants that buy the dips. Some call these actions wise while others call it market manipulation by funds and/or central banks. However, our purpose here was to present the facts and not to get immersed into theories that are hard or impossible to prove.
What could go wrong in an extreme mean-reversion regime?
If dip buyers stop buying the dips, the market may collapse as it did earlier this year. When this happens there is a sudden reversal from extreme mean-reversion to momentum as it was the case in March of this year. This is the underline risk of an extreme mean-reversion regime, i.e., a sudden reversal to a momentum regime where down days are followed by down days with higher probability. Note that Robinhood traders that are allowed to only go long equities are acting as a stabilization factor at this point while a firm that has been accused of massive call buying has basically acted as the driver of major dip buying due to market makers hedging their short option positions. In fact, there is high probability that without the massive call buying and Robinhood traders, the stock market would be significantly lower at this point.
Also see: Forbes Interview.
Charting and backtesting program: Amibroker
Data provider: Norgate Data
If you found this article interesting, you may follow this blog via push notifications, RSS or Email, or in Twitter

Price Action Lab Blog Premium Content


