


The golden cross moving average signal, when applied to the S&P 500 index, has provided slightly better risk-adjusted returns but at the cost of destroying profitability.
A golden cross (the 50-day moving average crossing above the 200-day moving average) occurred in the S&P 500 index last month on February 2, and since then the index has fallen by 5.5%.
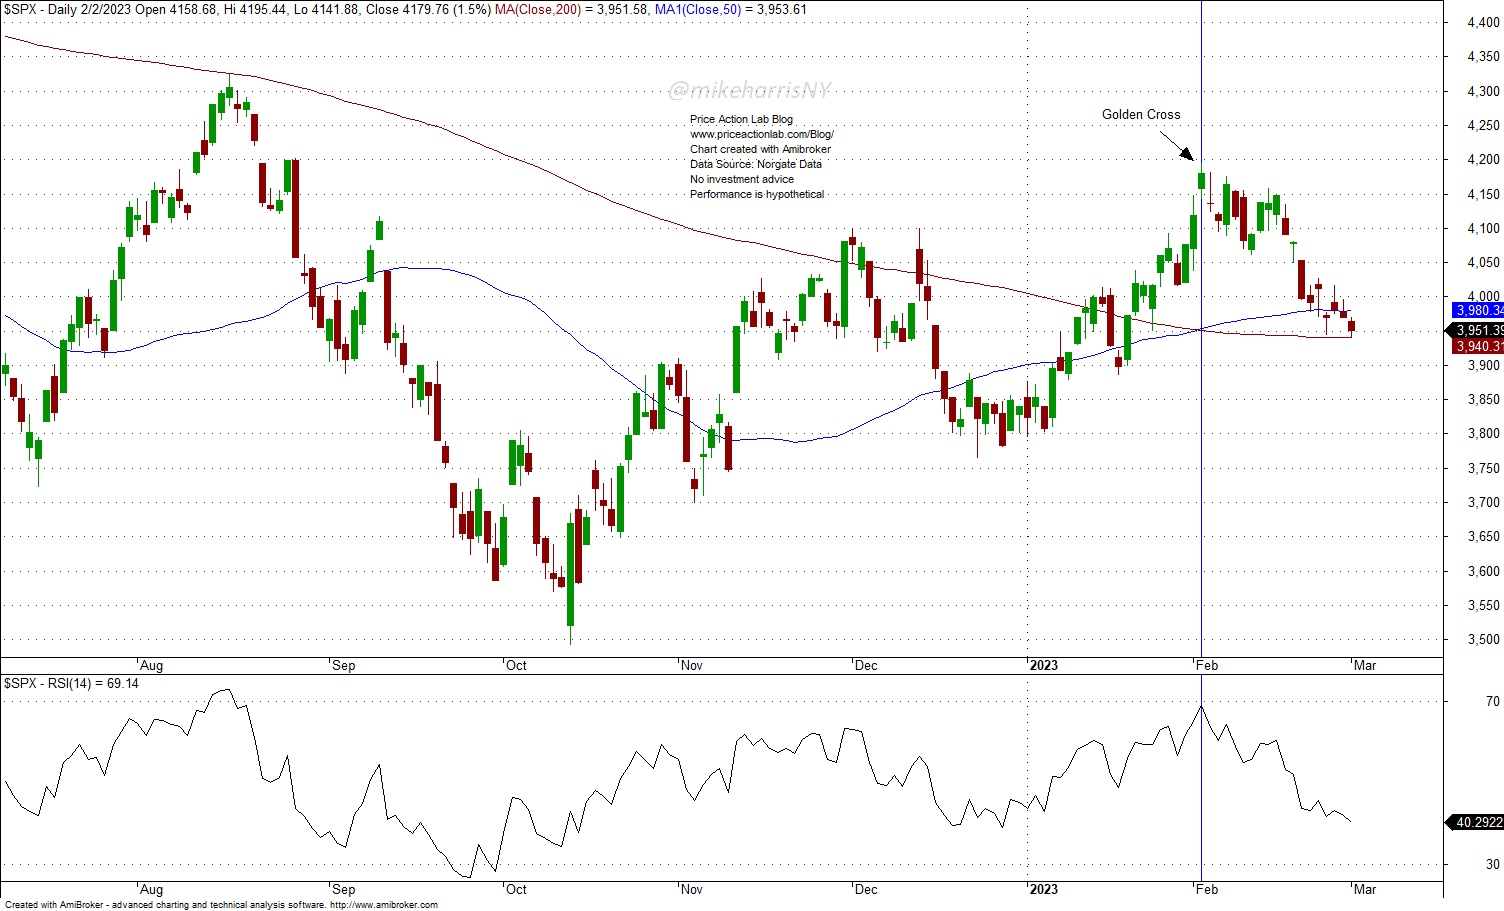
These golden cross signals usually occur near overbought levels, as shown on the chart above, and are followed by a correction.
Since 1944, there have been 42 golden cross signals in the S&P 500, and 19 of them, or 46.3%, had a maximum adverse excursion (MAE) of more than 4%.
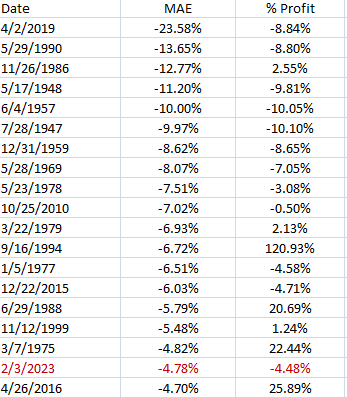
In addition, using the death cross as the exit signal, the golden cross signal has generated a profit after an MAE of 4% on only seven occasions.
More importantly, using the golden cross as an entry signal and the death cross as an exit has provided some improvement in risk-adjusted returns over buying and holding, but at the cost of destroying profitability.
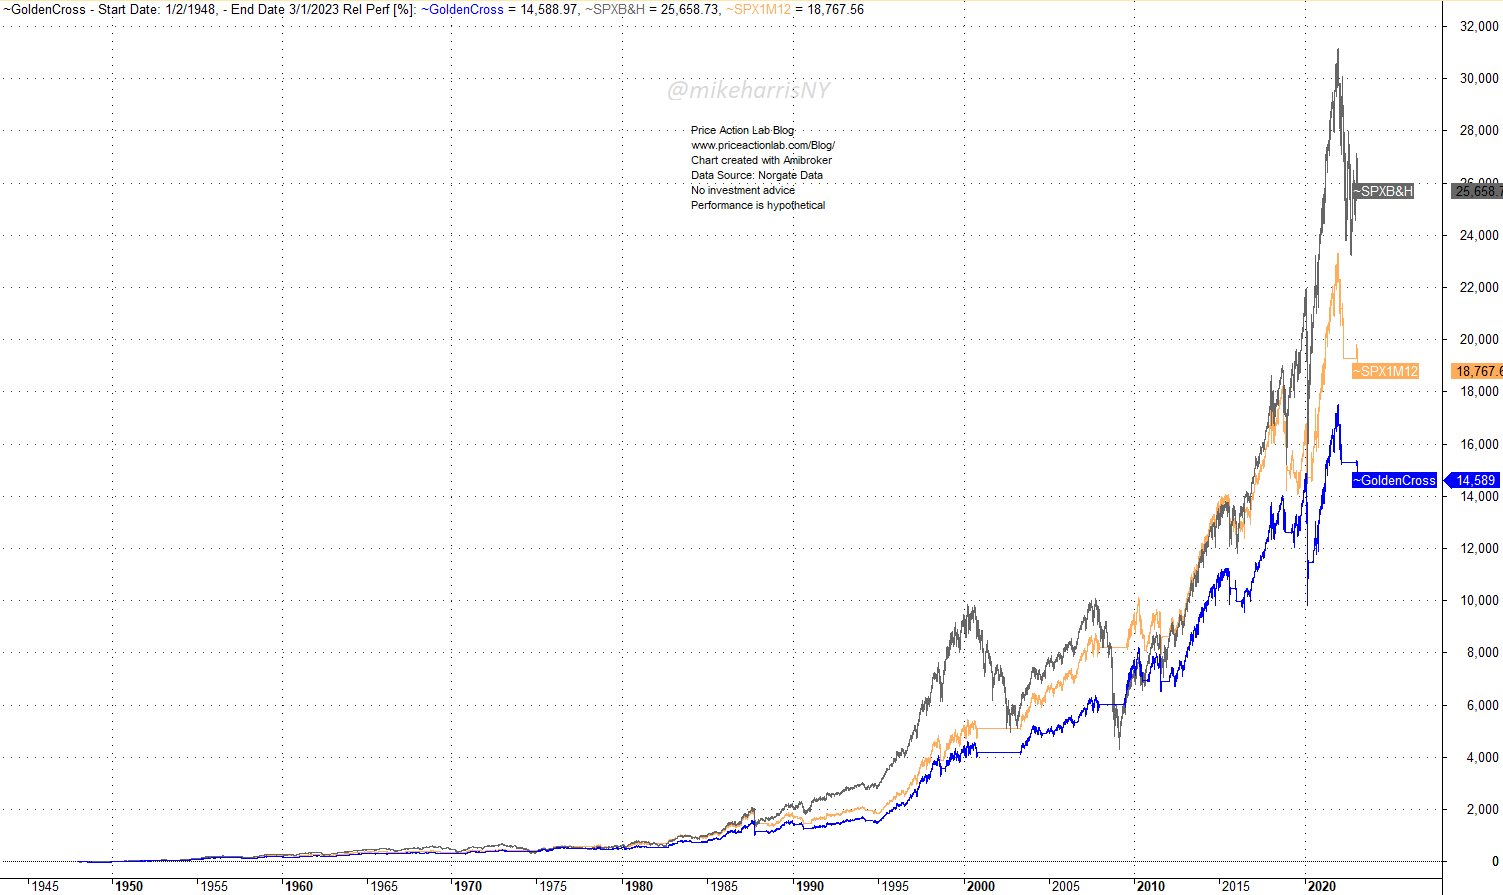
The total return of the golden cross strategy (blue line) is half that of buying and holding (gray line). The 12-month momentum has performed better. See this article for more details.
The conclusion is that the golden cross hasn’t helped market timing much more than other methods for the S&P 500 index, and it hurts profits for people who don’t care about drawdowns. The 12-month moving average seems to have provided a better timing signal so far.
15% off all premium content with Discount Code PAL15
By subscribing you have immediate access to hundreds of articles. Premium Insights subscribers have immediate access to more than a hundred articles and All in One subscribers have access to all premium articles, books, premium insights, and market signals content.
Free Book
Subscribe for free notifications of new posts and updates from the Price Action Lab Blog and receive a PDF of the book “Profitability and Systematic Trading” (Wiley, 2008) free of charge.
Disclaimer: No part of the analysis in this blog constitutes a trade recommendation. The past performance of any trading system or methodology is not necessarily indicative of future results. Read the full disclaimer here.
Charting and backtesting program: Amibroker. Data provider: Norgate Data
If you found this article interesting, you may follow this blog via RSS, Email, or Twitter.


