


The overnight anomaly in SPY ETF reveals some interesting dynamics of price action but it is not a strategy that can be exploited for profit.
The overnight anomaly in SPY ETF is known since the late 1990s. There are many articles in this blog about this anomaly in SPY ETF and several other markets and securities.
As it may be seen below, regular trading hours (RTH) have contributed almost nothing to the rise of SPY ETF (total return) since its inception.

The red line is the overnight accumulation (close to open), the green line is the regular trading hours (RTH) accumulation (open to close) and the gray line is the accumulation of daily changes (close to close). RTH is noise.
Below is a backtest without commissions that exploit this anomaly: buy at the close and exit at the next open. Backtest period: 01/29/1993 – 10/07/2020.
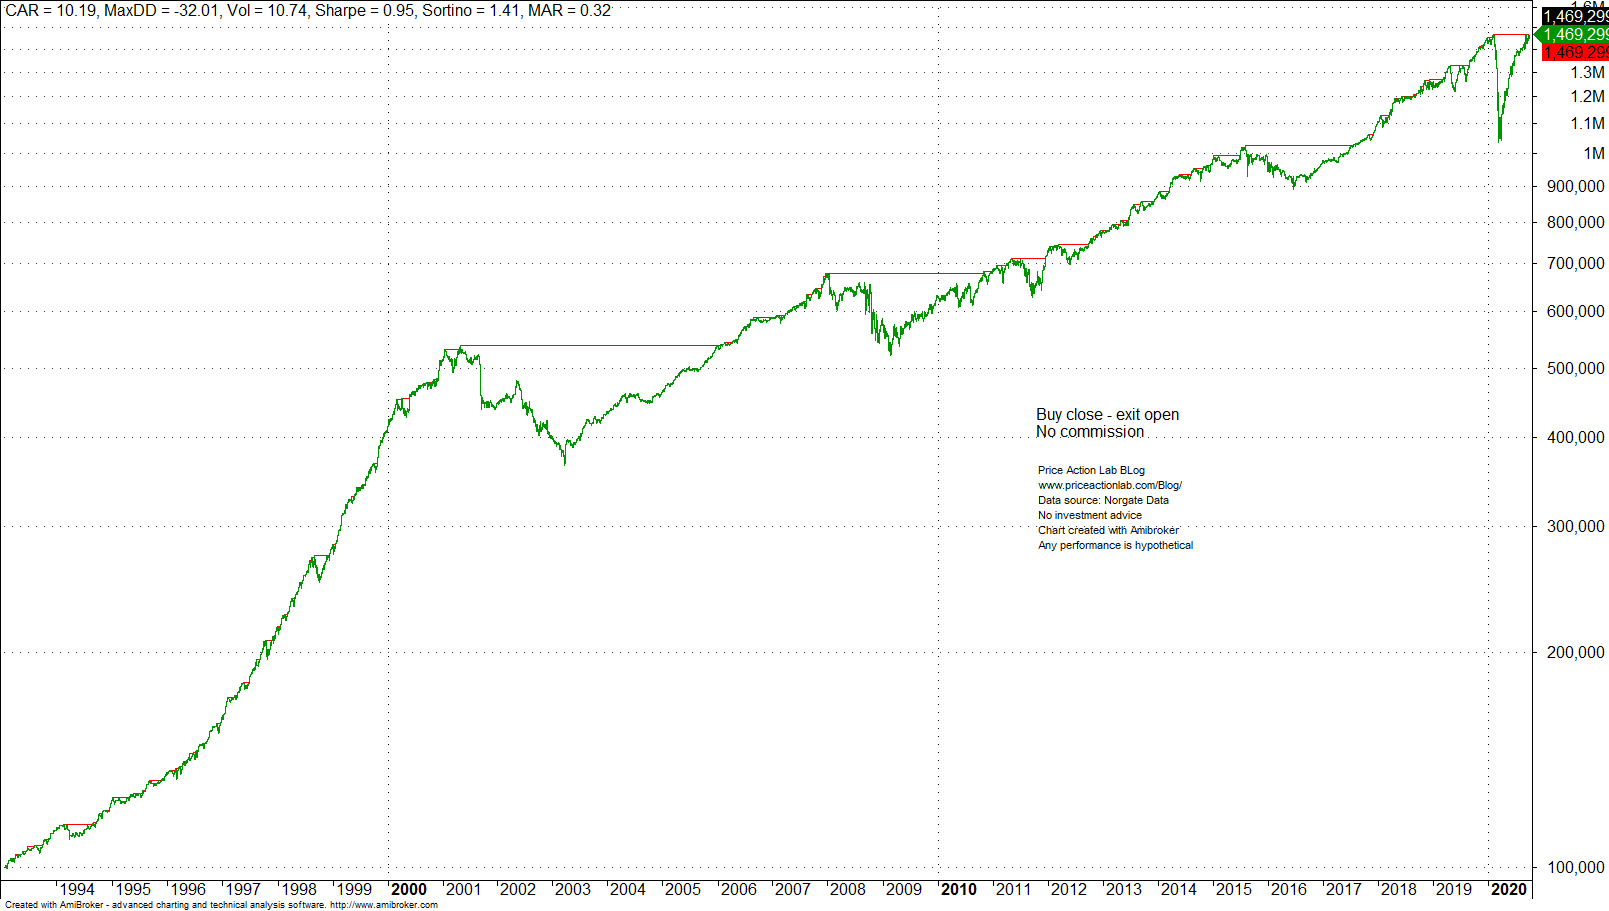
Annualized return is 10.2% and Sharpe is 0.95. Buy and hold annualized return is 9.7% and Sharpe is 0.51 (Rf=0).
However, this is what happens to the backtest equity if we add $0.01 per share for commission and slippage.

Sharpe drops to 0.31 and much below buy and hold. Small friction destroys the performance of the overnight anomaly. The maximum drawdown is also comparable to that of buy and hold. Annualized return plunges to 3.4%.
On the other hand, a 50/200 long-only moving average cross has outperformed buy and hold on a risk-adjusted basis since SPY ETF inception, as may be seen below.
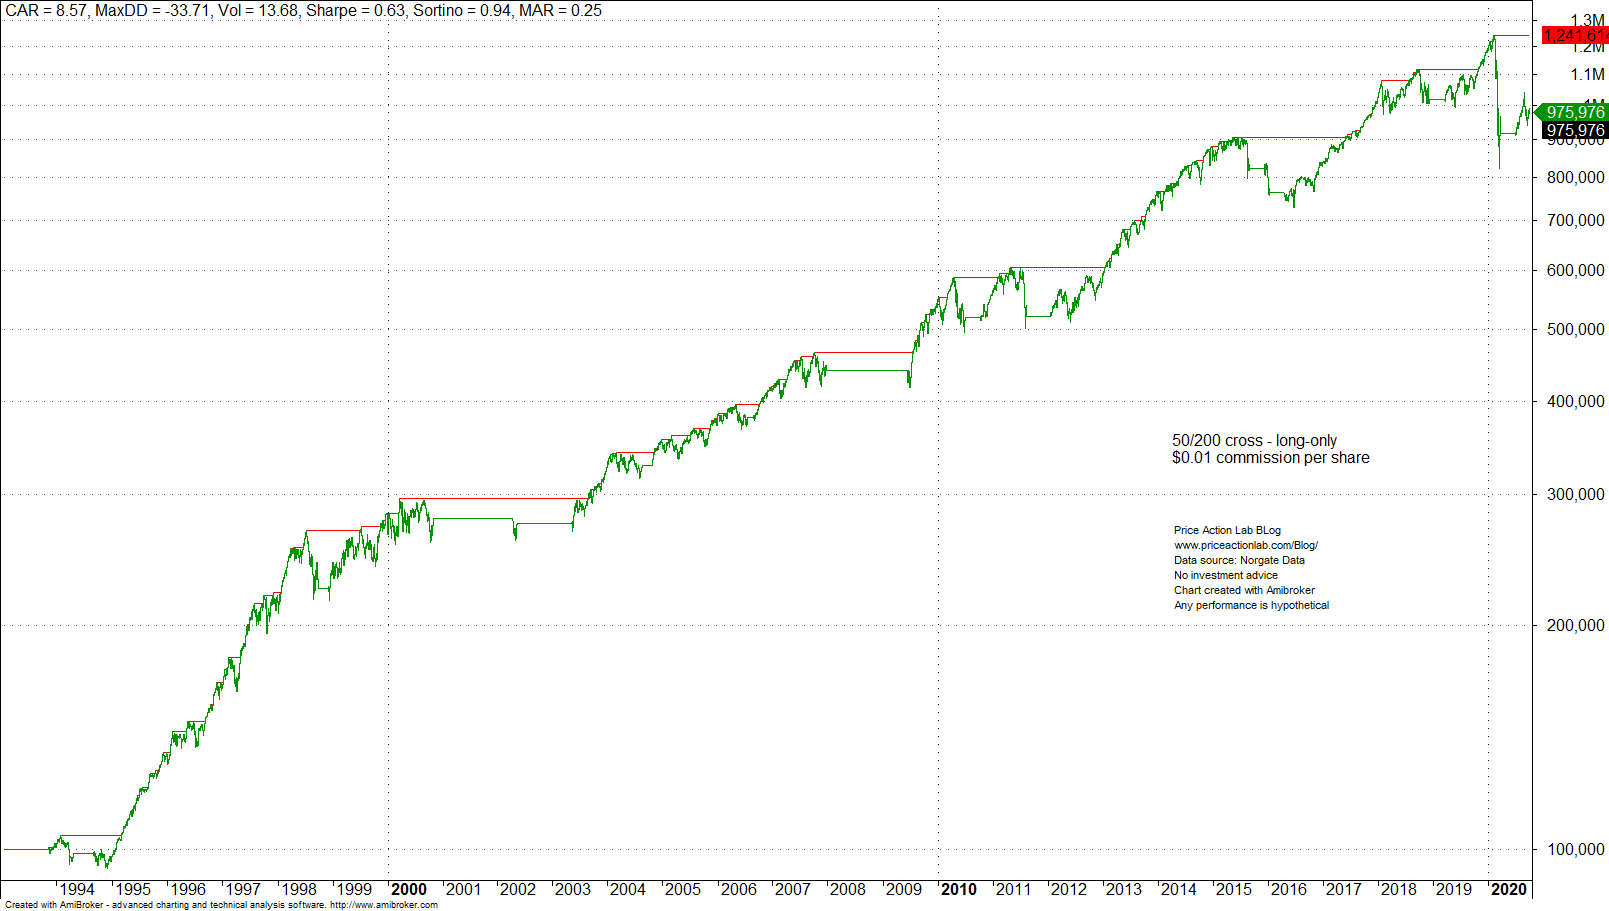
By incurring low transaction costs the (otherwise unintelligent) golden-cross strategy has done relatively well except in the fast crash earlier this year.
SPY ETF has been mean-reverting in daily returns since inception. Below is the performance of our proprietary PSI5 algo that is based on a formula from a text in probability theory. Sharpe from inception to 01/07/2020 is 0.67.
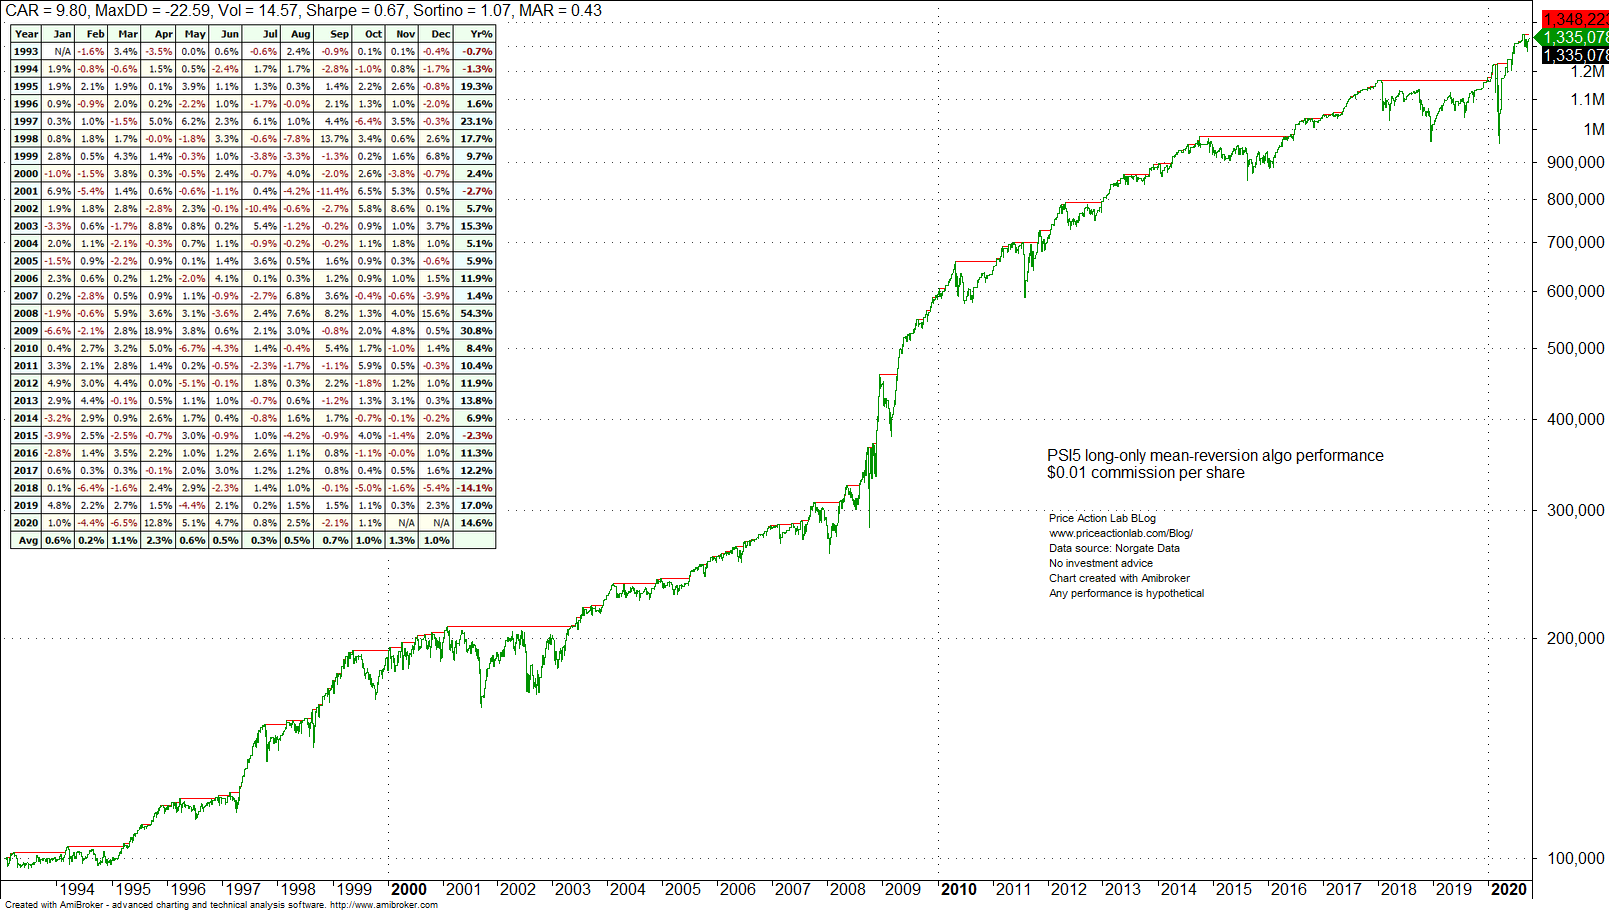
Year-to-date performance is about 15%. This algo has done well during bear markets and corrections because of the frequent short-covering rallies.
Not all price action anomalies can be exploited for profit and the overnight anomaly is an example of that.
Charting and backtesting program: Amibroker
Data provider: Norgate Data
If you found this article interesting, you may follow this blog via push notifications, RSS or Email, or on Twitter

Price Action Lab Blog Premium Content


