


This article includes examples of machine learning feature engineering for weekly NASDAQ-100 since 1985 and monthly S&P 500 since 1941.
Does feature engineering work with weekly and monthly data? More importantly, how does it compare to buy and hold performance?
The bulk of machine learning articles in financial blogosphere focus on not so relevant accuracy rates and other machine learning metrics that are not easy to translate to popular metrics used by investors and traders. In my opinion this is because (a) those writing the articles do not have experience with trading system development and (b) some think fancy terminology will obscure practical issues. Needless to say, both are wrong and experienced traders understand that. No one cares if a machine learning algorithm has 60% accuracy when the Sharpe ratio is 0.2 or lower.
“But the ML algo was more than 60% successful in forecasting next daily returns!”
No one cares about the accuracy. It is the annualized return, maximum drawdown and Sharpe among other metrics people with skin in the game primarily care about.
In this article we will use DLPAL LS to create monthly features for S&P 500 and weekly features for NASDAQ-100 and then determine the key performance parameters of a simple trading strategy.
DLPAL LS calculates features from price series that can be used for the development of long/short but also directional strategies. Click here for more details about the program.
Below is a table of data ranges and how the data will be used with DLPAL LS to generate features.
| Frequency | Data range | Feature range | |
| S&P 500 | Monthly | 19410829 – 20210129 | 20061130 – 20210129 |
| MASDAQ-100 | Weekly | 19851004 – 20210219 | 20140103 – 20210219 |
It must be made clear that DLPAL LS “feature range” is essentially the test sample. The sample up to the start of the feature range is used for feature construction and training. We are only interested in the performance in the test sample, which is the feature range.
Below is an example of how features for weekly NASDAQ-100 were generated.
We used 7% profit-target and stop-loss to classify features in the final feature clusters for NASDAQ-100 and 10% for S&P 500. These numbers were determined by price series analysis of weekly and monthly data. Other levels could be used as in the article we present only examples.
For NASDAQ-100 we decided that the history length (test sample) will be 373 weekly bars and for S&P 500 it will be 171 monthly bars. These can also be changed to choices of the program user.
We generated features for all four Major Cluster Types. We also tested smooth features but we will not include the results.
The trading strategy is simple and uses only Pdelta feature:
Buy = Pdelta >0
Sell = Pdelta <0
DLPAL LS adds the features to the data files and save them with .pih extension. Then these files are imported in Amibroker to backtest the strategies. The program also generates train and score files for those who would like to generate strategies with machine learning classification algorithms and obtain the probability of the next instance.
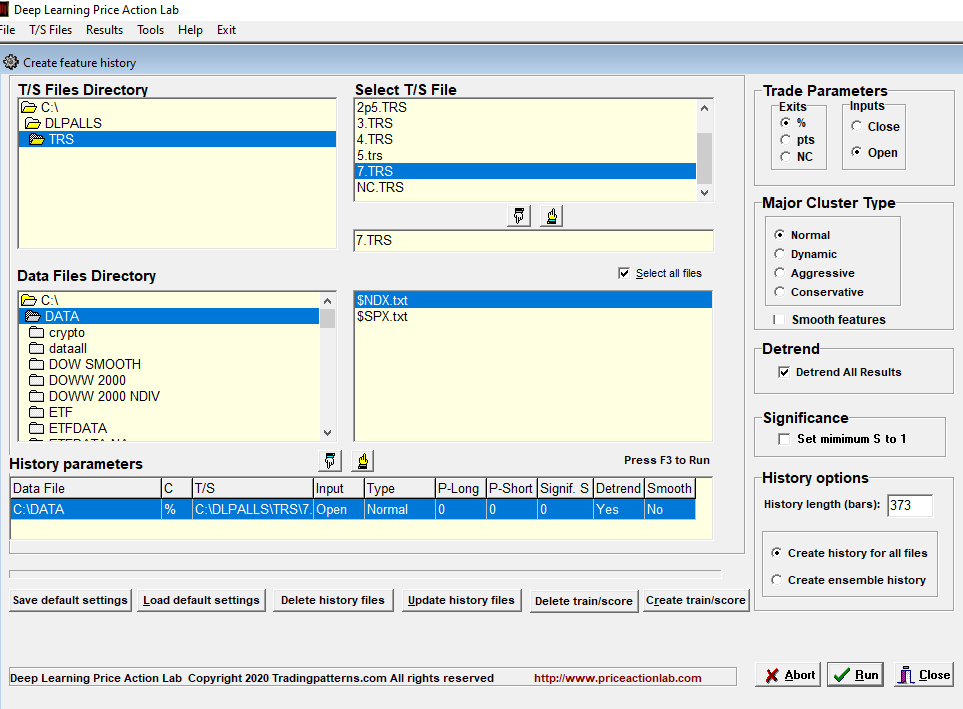
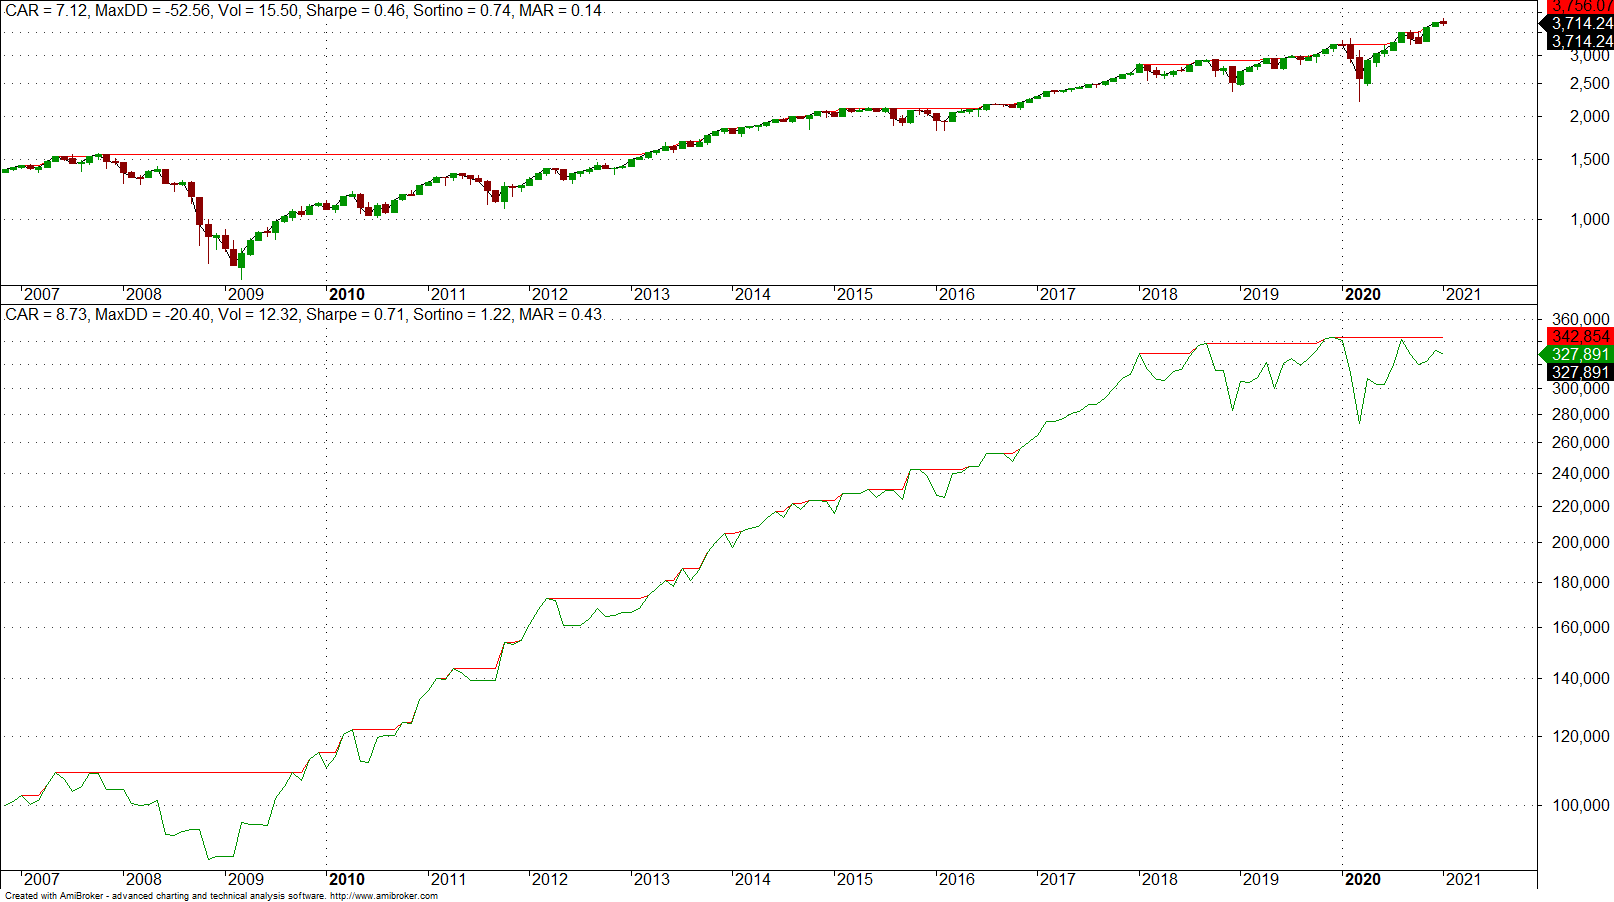
Results for S&P 500
| Normal | Dynamic | Aggressive | Conservative | Buy & Hold | |
| CAGR | 4.3% | 5.6% | 8.7% | 6.7% | 7.1% |
| MDD | -30.3% | -30.2% | -20.4% | -23.2 | -59.5% |
| Sharpe | 0.36 | 0.42 | 0.71 | 0.53 | 0.46 |
| Win rate | 60.0% | 68.7% | 72.7% | 57.9% | – |
The aggressive cluster outperformed buy and hold. The conservative cluster outperformed buy and hold on a risk-adjusted basis, as expected.
Below is the equity curve for the aggressive cluster.
Results for NASDAQ-100
| Normal | Dynamic | Aggressive | Conservative | Buy & Hold | |
| CAGR | 13.8% | 19.6% | 15.2% | 16.3% | 2.8% |
| MDD | -26.3% | -26.6% | -27.3% | -20.7% | -27.3% |
| Sharpe | 0.82 | 1.18 | 0.91 | 0.99 | 1.12 |
| Win rate | 58.5% | 72.6% | 67.5% | 60.1% | – |
The dynamic cluster outperformed buy and hold on a risk-adjusted basis. Below is the equity curve.
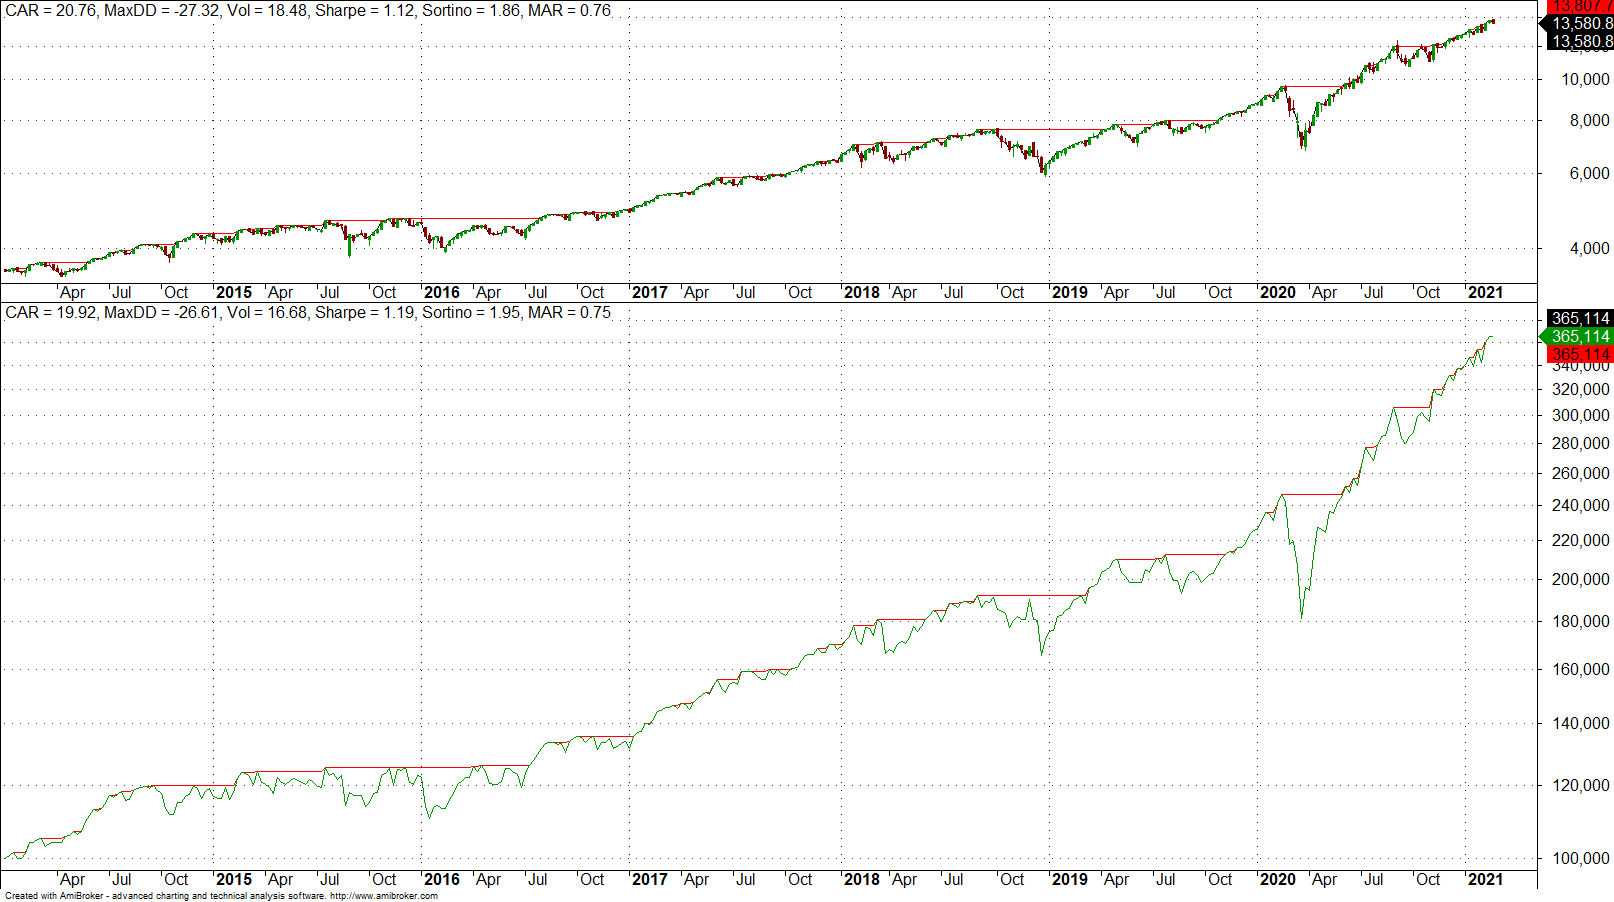
Note that in both markets above, the strategy tracked the price series returns and even avoided losses occasionally to improve absolute and risk-adjusted returns. This is basically the general idea. Also, in some of the cases long/short also performed well but is it unreasonable to expect it to outperform markets with strong upward bias.
Smoothed features
Smoothed features performed better or worse in some cases. For example, for S&P 500, the normal smoothed features outperformed buy and hold on both absolute and risk-adjusted basis.
The conclusion is that in addition to high accuracy (win rate) in all above cases, the features were also profitable based on popular metrics used by traders to evaluate trading strategies.
For more information about DLPAL LS click here.
The program manual can be found here.


