


We consider a typical rotational strategy for S&P 500 stocks and improve the performance via the use of a different ranking function. The details of the improved strategy are available to All in One premium content subscribers subject to subscription expiration date.
The base strategy we consider in this article is well-known: go long stocks with best performance and rebalance along the way.
However, as simple as the strategy may sound, there are some details to clarify before testing it that include the timeframe, ranking function and position size methodology.
For all backtests in this article we used Norgate data for S&P 500 index that include current and past constituents. We highly recommend this data service (we do not have a referral arrangement with the company.)

Timeframe: Monthly (adjusted data)
Index: S&P 500 (current and past constituents)
Basic rule: Buy at maximum 200 stocks with highest 12-month rate of change
Score: Select the stocks with the highest positive 12-month rate of change
Rebalancing period: Monthly
Bear market filter: None.
Position size: equity/200
Commission: $0.005/share
All trades are executed at the open of the next bar
Backtest range: 01/29/1993 –06/09/2021
Comments
- We use monthly timeframe to reduce turnover.
- We don’t use a bear market filter because this interferes with strategy dynamics.*
- We don’t use variable position sizing because that may cause issues with settlement rules.
- The length of the backtest matches the history of SPY ETF to have a fair comparison.
- The maximum number of positions precludes any retail use.**
* There is nothing wrong with using bear market filters but in general strategies that do may not be robust without them and also stay out of the market for extended periods of time and this is highly undesirable.
** One other reason bear market filters are often used is because with a low number for maximum open positions these rotational strategies have large drawdown during bear markets. More about that below.
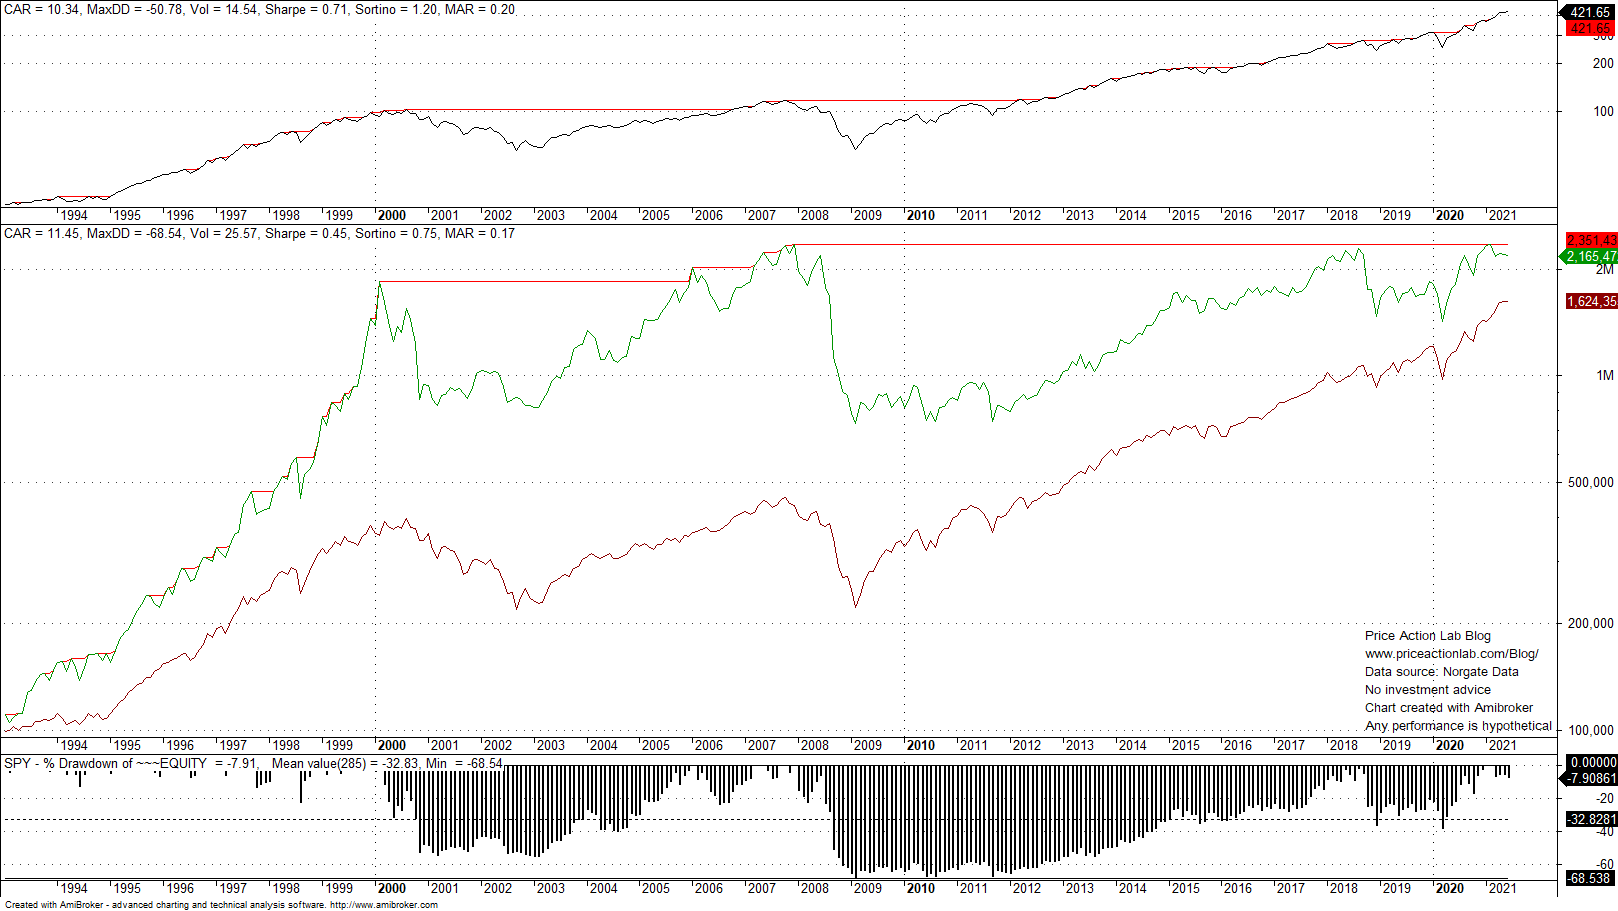
Equity curve (green) and comparison to SPY total return (red)

Annualized return (CAGR) for the strategy is 12.3% versus 10.3% for the benchmark. Maximum drawdown for the strategy is -27.4% versus -51% for buy and hold. Sharpe for the strategy is nearly 1 versus 0.7 for the benchmark. Overall this looks like a good strategy that outperforms buy and hold but there is a problem: the maximum drawdown is large.
I see backtests in blogs all the time with strategies having more than 30% drawdown. This may be fine for retail but it’s prohibitive for professionals. We will attempt next to see if this basic strategy can be improved without major changes. But before that, a few words about maximum positions held and why set at 200. The table below shows the results for CAGR and maximum drawdown % as a function of maximum positions held when varied from 10 to 250 in increments of 10.
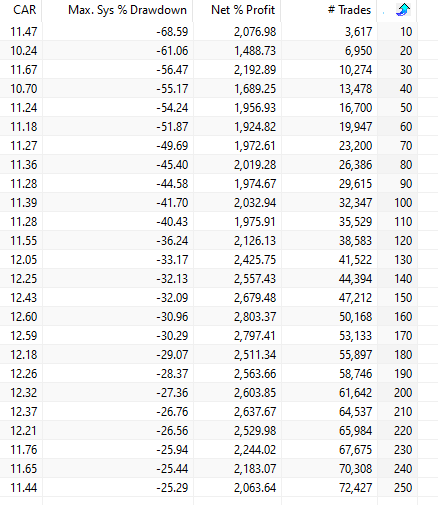
It may be seen that drawdown decreases as the number of maximum positions held increases. Actually, 200 is not the optimum value for maximum CAGR or minimum drawdown. The equity curve for 10 positions is shown below.
Although CAGR is high, this is a terrible strategy. Therefore, to save this for retail, a bear market filter is inserted so that no new positions are opened if SPY monthly price is below the 12-month moving average. Below is the resulting equity curve.
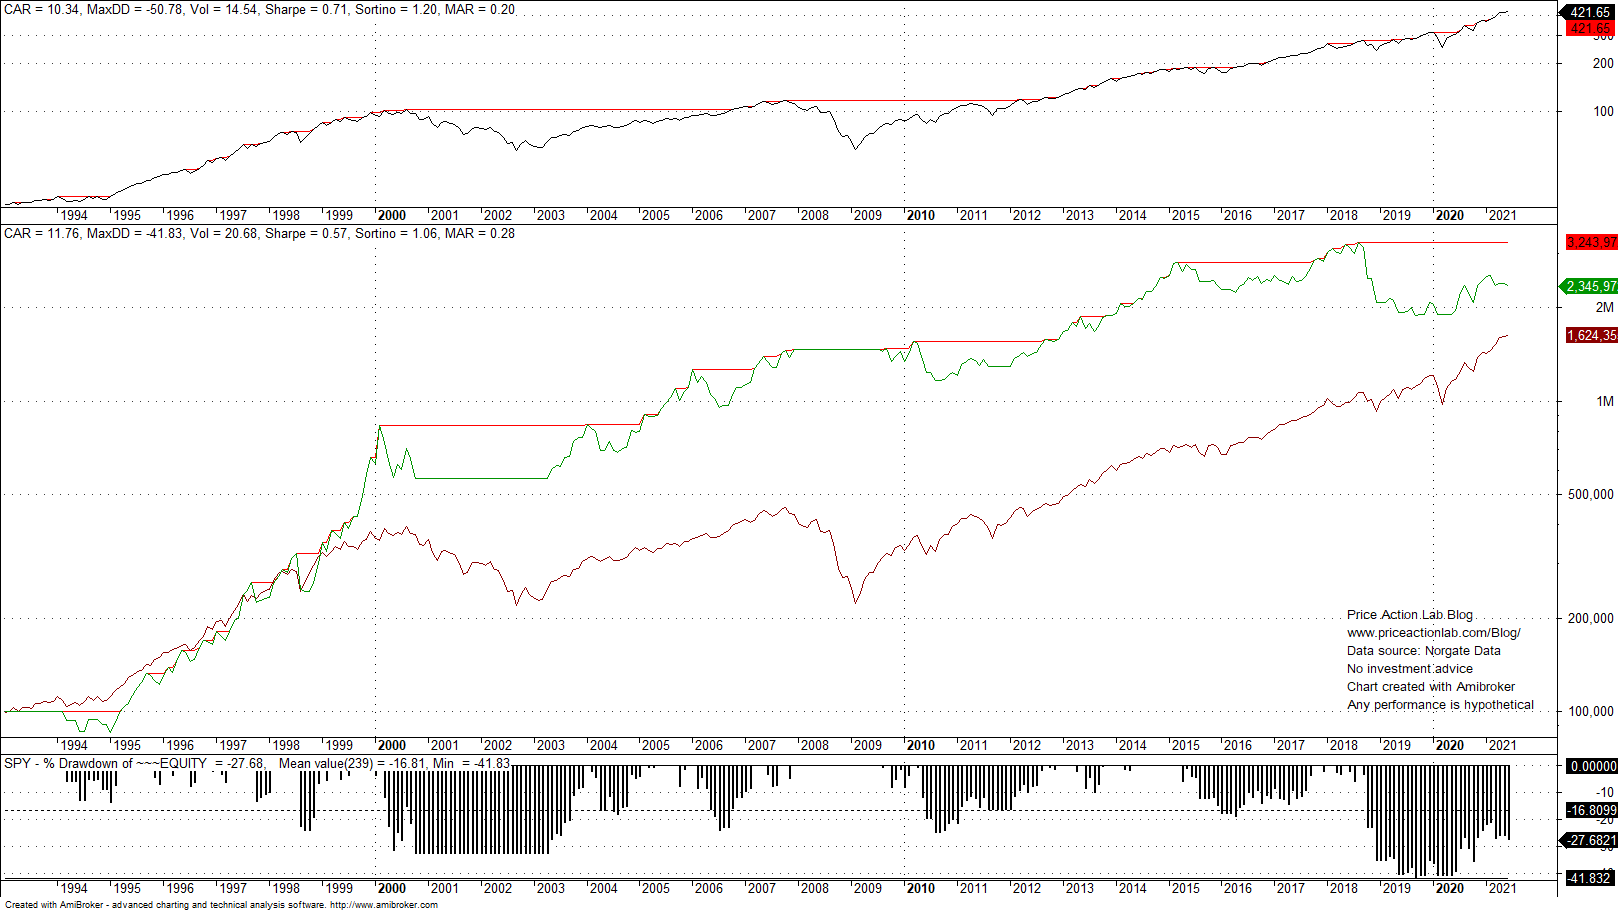
Until 2020 this trick worked but due to the fast crash the filter failed to respond because of the lag. Unfortunately, some of those who employ these filters have not updated their backtests. There is significant reduction to maximum drawdown but still not enough to justify use of the strategy. Needless to say some will add more filters and over-fit only for the strategy to fail forwards as it did in 2020. In addition, backtest interval is often chosen to show good results. There is no reason for not matching the trading history of SPY ETF since the data for delistings are available.
Improvement
We would like to improve the basic strategy but not via the use of filters for reasons already mentioned. The only choice we have is the ranking function but we want to also keep this as simple as possible to avoid over-fitting. In addition, ranking should make sense and not being in the form of some abstract function generated by some trial-and-error or genetic algorithm. Below is the result of our effort.
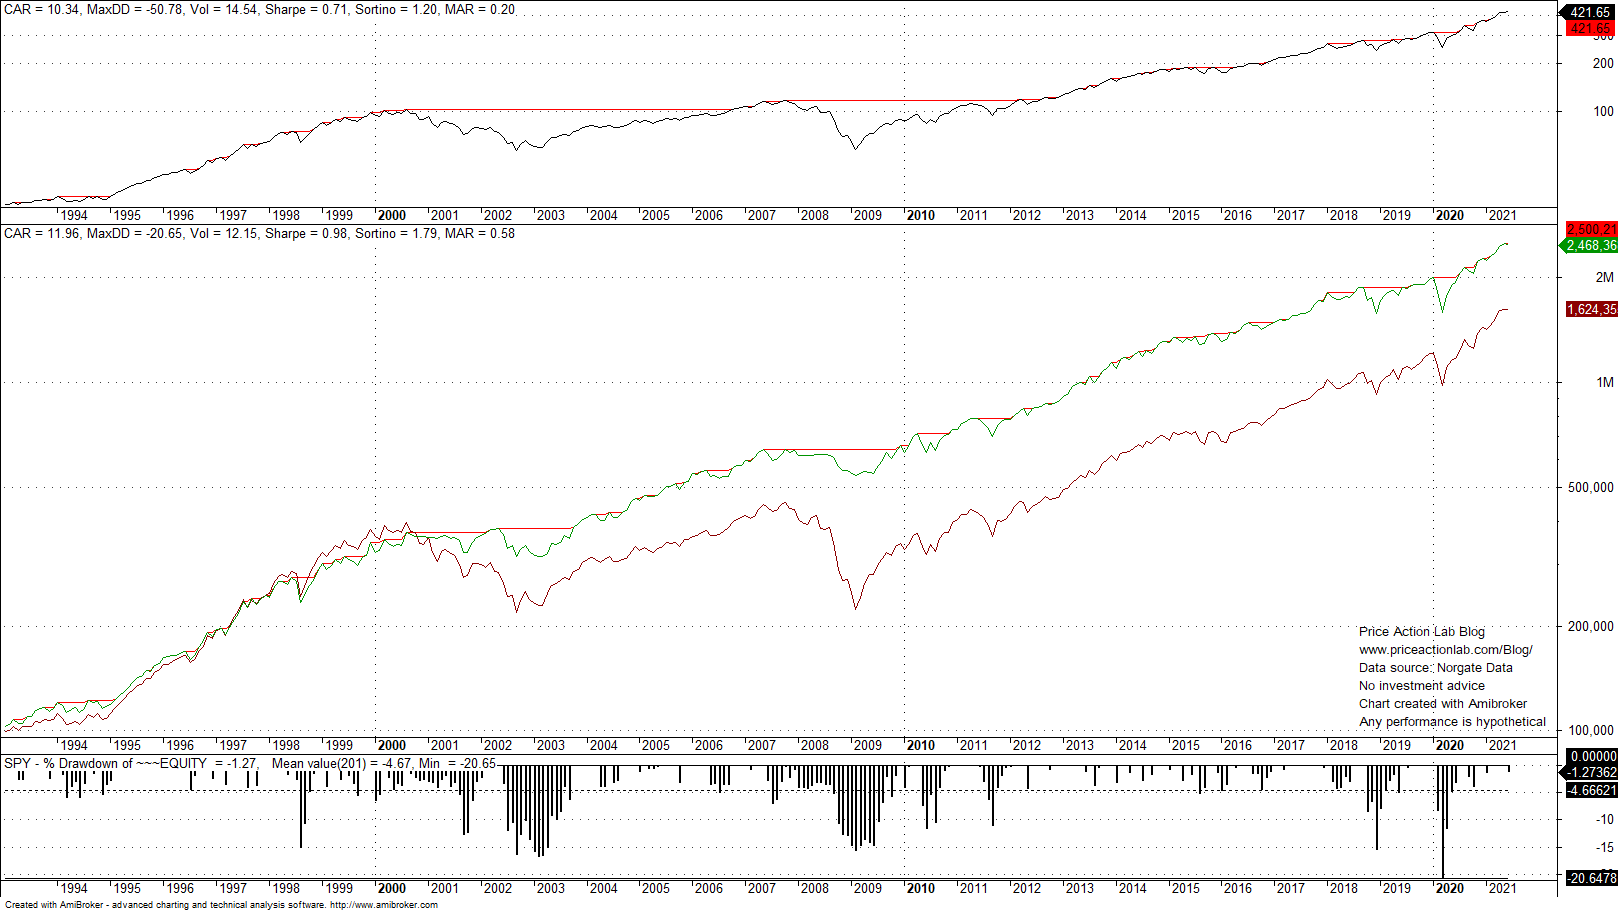
There is significant improvement: GAGR is still near 12% but maximum drawdown is down to -20.7% from -27.3%. Sharpe has remained close to 1. This equity curve was obtained without any filters, with long-only positions and with the change in ranking function to something that intuitively makes sense. The details of the strategy are available below to profession traders and hedge funds. Contact us for details on unlocking the restricted content.
|
This post is for paid subscribers
Already a subscriber? Sign in |
Click here for a list of strategies.
Disclaimer: No part of the analysis in this blog constitutes a trade recommendation. The past performance of any trading system or methodology is not necessarily indicative of future results. Read the full disclaimer here.
Charting and backtesting program: Amibroker. Data provider: Norgate Data
If you found this article interesting, you may follow this blog via RSS or Email, or in Twitter

Price Action Lab Blog Premium Content


