


Year-to-date performance of a long/short strategy for NASDAQ-100 stocks is about 32%. The strategy trades a variable number of securities and maintains a market bias depending on the values of the features used.
The features of the strategy are calculated daily after the market close by DLPAL LS software. Below are the details of the strategy and backtest.
Market: NASDAQ-100 stocks
Timeframe: Daily
Strategy type: Long/short
Minimum number of shares per position: 100
Position size: Variable based on open positions
Backtest period: 01/04/2021 – 06/03/2021
Strategy
Buy if P-long > 65
Sell if P-short > 55
Short if P-short > 65
Cover if P-long > 55
P-long and P-short are features calculated by DLPAL LS software and indicate the probability (0% – 100%) of long and short directional bias of a security. A few other features are also calculated by the program.
Below is the equity curve from the backtest of the above strategy.
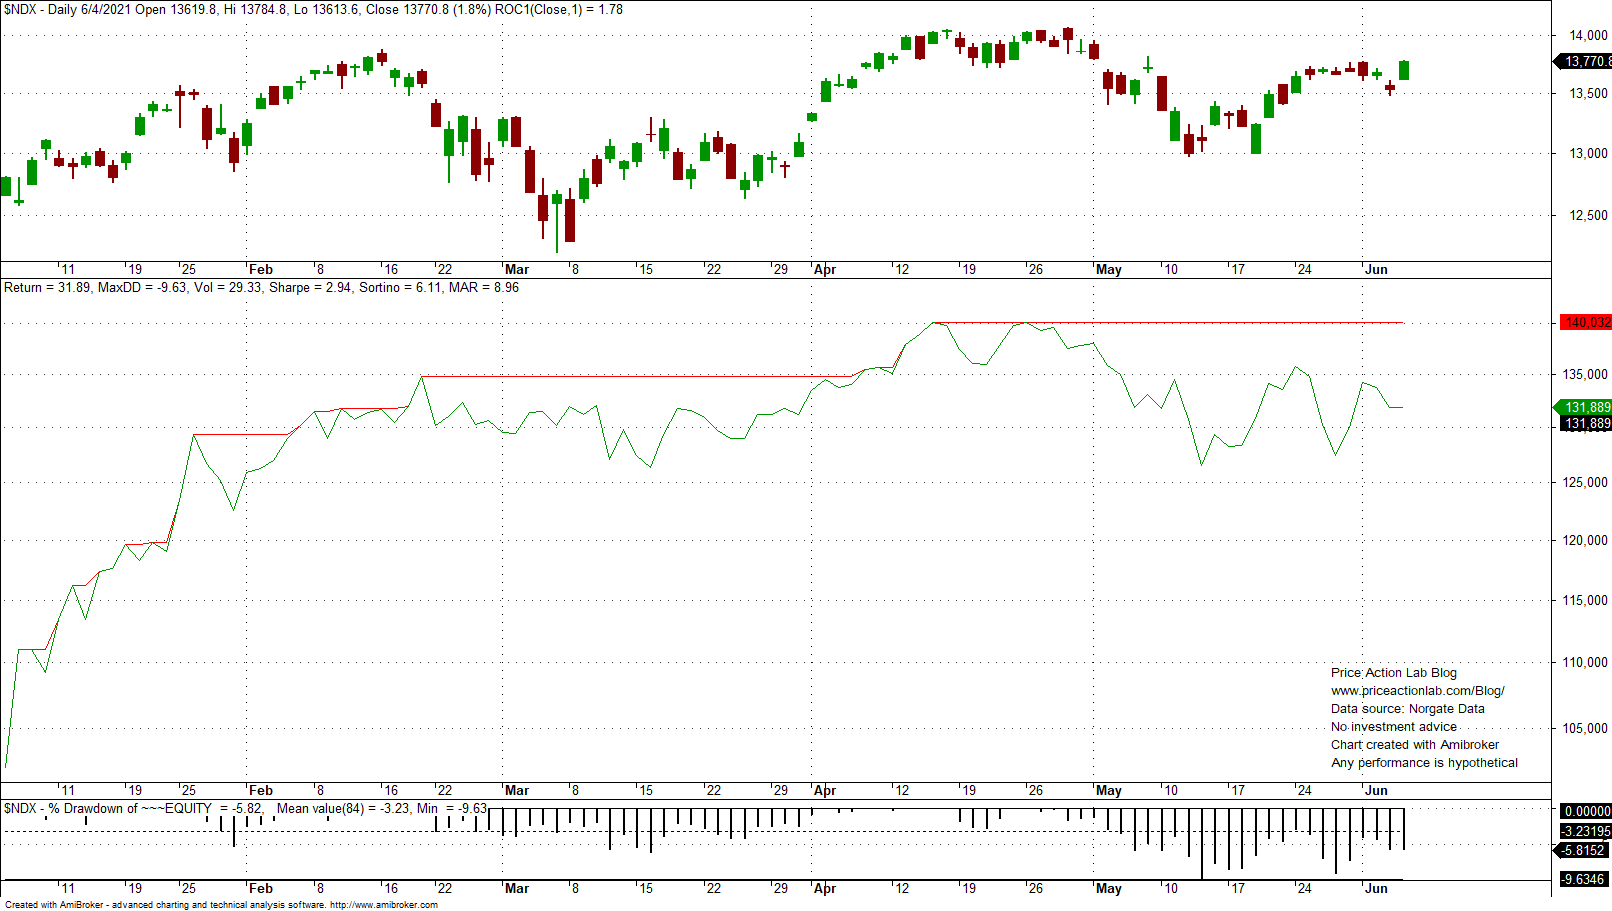
The strategy is up 31.9& year-to-date at 9.6% maximum drawdown. Performance peaked on April 26 at 40% and has decreased about 8% since.
| Long/Short Strategy | NASDAQ-100 | |
| Return | 31.9% | 5.9% |
| Maximum drawdown | -9.6% | -9.9% |
| Sharpe | 2.9 | 0.87 |
| Trades | 35 | |
| Win rate | 60% | |
| Long trades/Return | 23/25.2% | |
| Short trades/Return | 12/6.7% | |
| Average bars in trades | 8.7 | |
| Exposure | 89.3 |
Note that there are many ways the features calculated by DLPAL LS can be used in a strategy. For more details and examples click here.
More details about DLPAL LS can be found here. For more articles about DLPAL LS click here.
Please read our Disclaimer and Terms and Conditions before ordering a demo or full version of DLPAL LS.


