


In this article we describe how we create a watchlist of stocks with extreme overbought/oversold conditions and then apply a long/short strategy.
We consider Russell 3000 constituent stocks as the primary universe and then scan for stocks that are more that 10 days overbought (RSI(14) > 70) or oversold (RSI(14) < 30). Any indicators can be used to create a sub-universe of stocks from a primary universe but we are interested here in extreme overbought/oversold conditions.
Note that we check for securities that appear overbought due to buyouts, mergers, etc. and remove those from the final selection.
Below is an example of the results after the close of Friday, July 23, 2021.
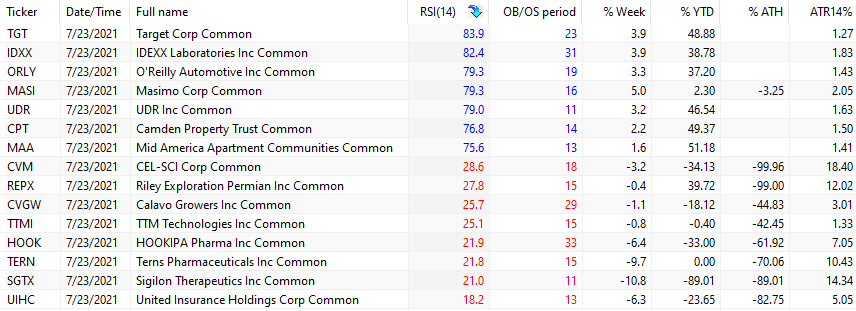
There are seven overbought stocks and eight oversold according to our scan criteria.
Since we don’t know how overbought/oversold conditions relate to short-term trend, we will use a long/short algorithm to determine the probability of the sign of the next day return from open to close. Note that the algo requires at sufficient history of daily prices and as a result three stocks won’t be considered.
We use DLPAL LS software with a workspace as shown below:
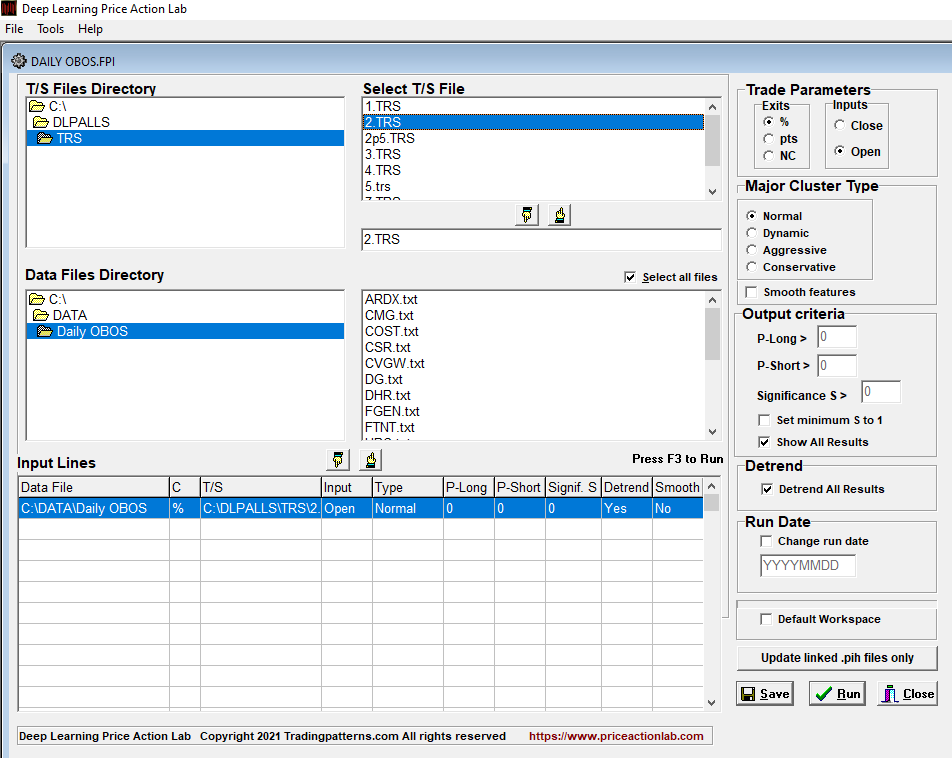
After we click Run, the software considers each security and calculates a set of features. P-long and P-short are two of the features calculated by DLPAL LS software and indicate the probability (0% – 100%) of long and short directional bias of a security.

P-delta is P-long minus P-short and an indication of the short-term directional bias next day from open to close. If P- delta is positive than the Signal is Long and if negative it’s Short.
In the above example, there are six long and six short stocks but 50:50 split is not always the case. In extreme cases, all signals may be long or short.
After the close of the next trading day, we update our data and calculate the performance from open to close of the above signals.

Two long stocks and four short stocks gained from open to close. The average gain of the 12 stocks was 0.4%.
Note that usually the above analysis is used in the context of discretionary trading and all the signals are not considered but only those that are confirmed by other indicators. Therefore, knowing how such a method would have performed in the past is impossible.
There are unlimited ways of creating sub-universes after scanning a universe of securities using specific technical and even fundamental criteria and therefore there are also unlimited long/short analysis options. The above was just an example we use for our reports to our premium subscribers.
DLPAL LS software is available for sale only to qualified professional traders and hedge funds. A fully functional trial is available at a fee. Click here for more details.
More details about DLPAL LS can be found here. For more articles about DLPAL LS click here.
Please read our Disclaimer and Terms and Conditions before ordering a demo or full version of DLPAL LS.


