


The long-only mean-reversion strategy for trading a portfolio consisting of SPY, QQQ, and TLT ETFs is based on price breakouts.
The strategy rules are available below to All in One premium content subscribers who renew their subscription for three months or to new subscribers for a six-month initial subscription. Contact us for details. This offer may end at any time.
For all backtests in this article, we used Norgate data. We highly recommend this data service (we do not have a referral arrangement with the company). Last update: December 29, 2023.

Timeframe: Daily (adjusted data)
Markets: SPY, QQQ, TLT
Strategy type: Long-only mean-reversion
Maximum positions: 3 (recommended setting)
Position size: equity/3
Commission: $0.005/share
All trades are executed at the open of the next bar
Backtest range: 01/2/2002 –12/29/2023
Note that the strategy is not optimized for the highest annualized return.
Equity curve
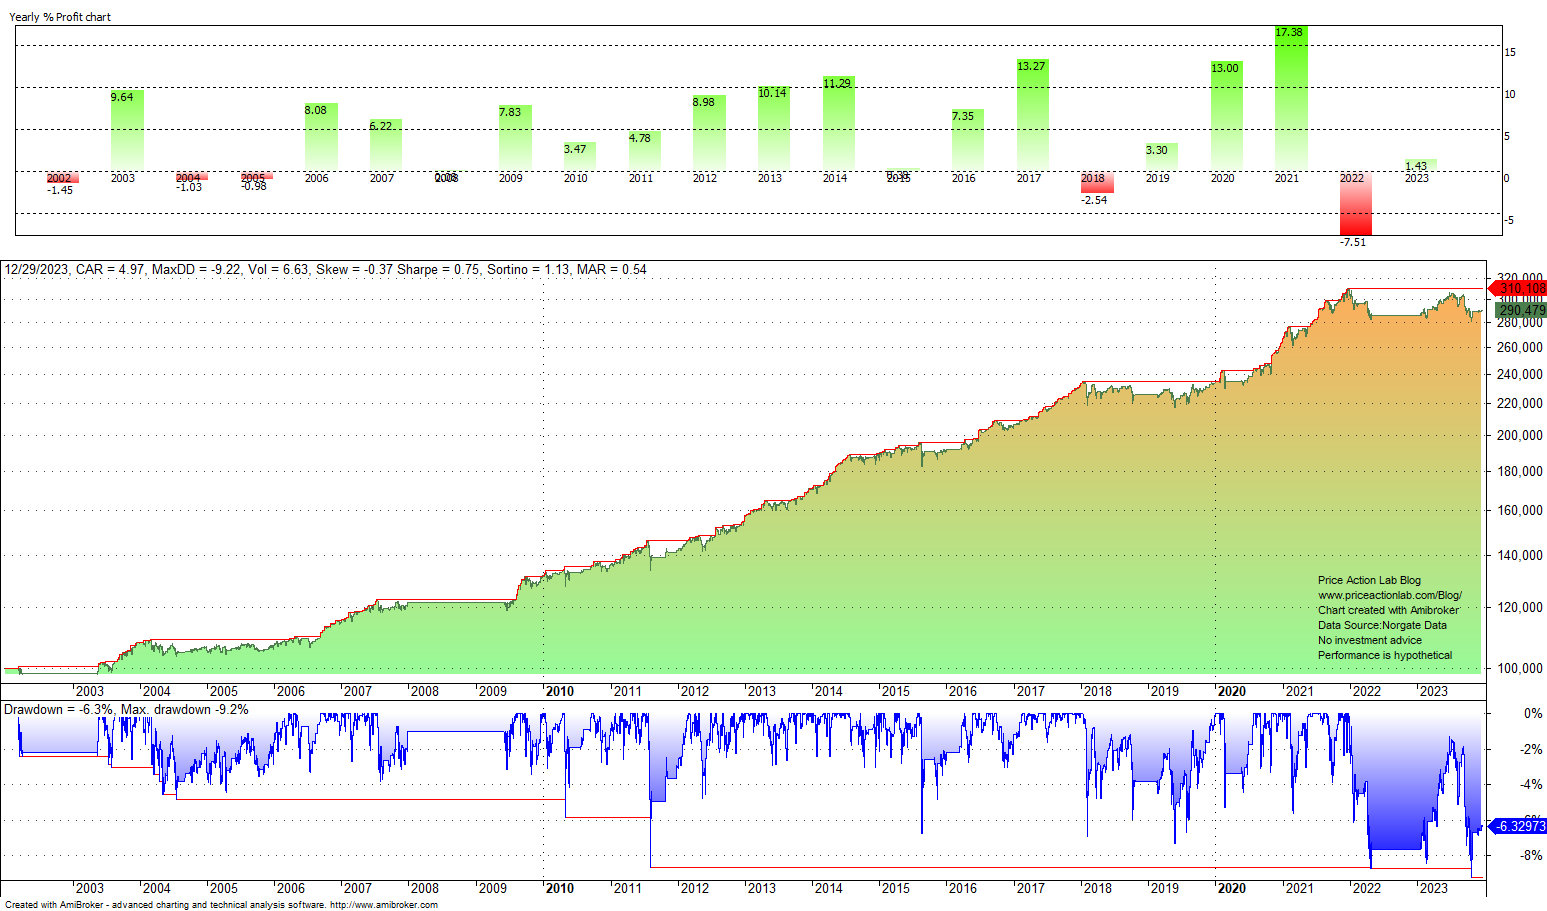
Performance Summary
| STRATEGY | |
| CAGR | 5.0% |
| MDD | -9.2% |
| VOLATILITY | 6.6% |
| SHARPE | 0.75 |
| TRADES | 761 |
| WIN RATE | 70.2% |
| AVG. BARS IN TRADE | 7.6 |
| EXPOSURE | 30.2% |
The strategy’s CAGR is 5%. The maximum drawdown of the strategy is 9.2%. The Sharpe of the strategy is 0.75. The volatility of the strategy is 6.6%.
The average holding period is 7.6 days. The strategy uses a bear market filter. Only one position may also be held. Below are the backtest results.
Backtest settings
Timeframe: Daily (adjusted data)
Markets: SPY, QQQ, TLT
Strategy type: Long-only mean-reversion
Maximum positions: 1
Position size: Fully invested
Commission: $0.005/share
All trades are executed at the open of the next bar
Backtest range: 01/2/2002 –12/29/2023
Equity Curve
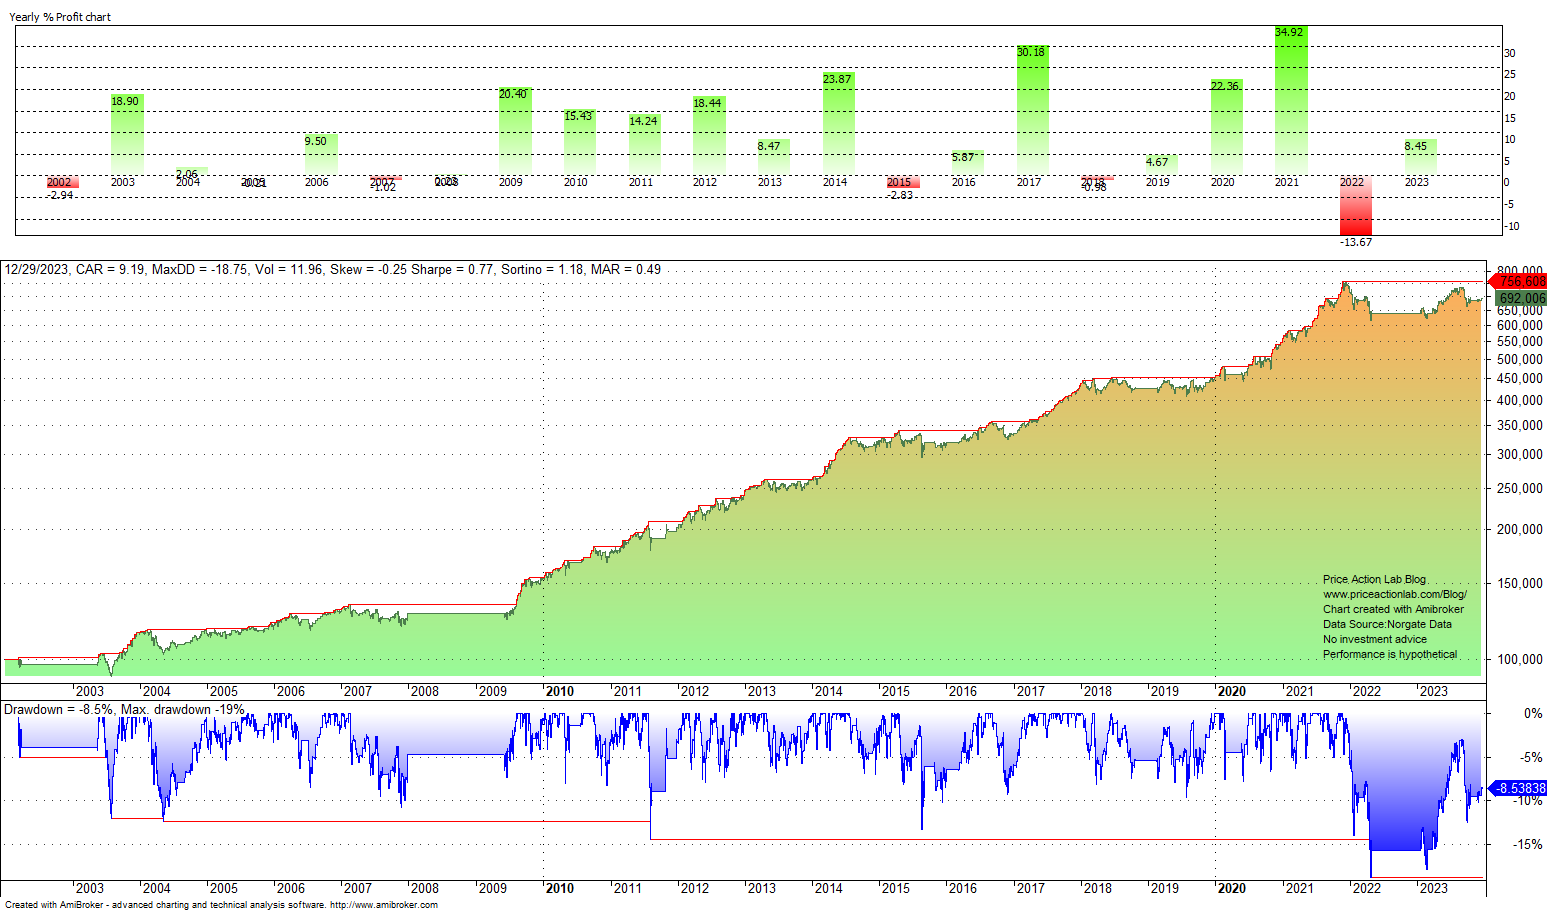
Performance Summary
| STRATEGY | |
| CAGR | 9.2% |
| MDD | -18.8% |
| VOLATILITY | 12.0% |
| SHARPE | 0.77 |
| TRADES | 441 |
| WIN RATE | 70.1% |
| AVG. BARS IN TRADE | 7.6 |
| EXPOSURE | 53.0% |
The strategy’s CAGR is 9.2%. The Sharpe of the strategy is 0.77 versus 0.34 for buy and hold in the same period. The average holding period is 7.6 days.
The rules of the strategy are available to All in One premium content subscribers who renew their subscription for three months or to new subscribers for a six-month initial subscription. Contact us for details.
|
This post is for paid subscribers
Already a subscriber? Sign in |
Click here for a list of strategies.
Disclaimer: No part of the analysis in this blog constitutes a trade recommendation. The past performance of any trading system or methodology is not necessarily indicative of future results. Read the full disclaimer here.
Charting and backtesting program: Amibroker. Data provider: Norgate Data
If you found this article interesting, you may follow this blog via RSS, Email, or Twitter


