


Mean-reversion in daily stock market returns is waning after the extreme levels reached late last year. Since mean-reversion in daily returns is the result of buying the dips, a reversal to momentum could be problematic near all-time highs.
As shown in the chart below, 1-lag, 252-day autocorrelation of daily returns of the S&P 500 index reached extreme levels after the crash of last year.
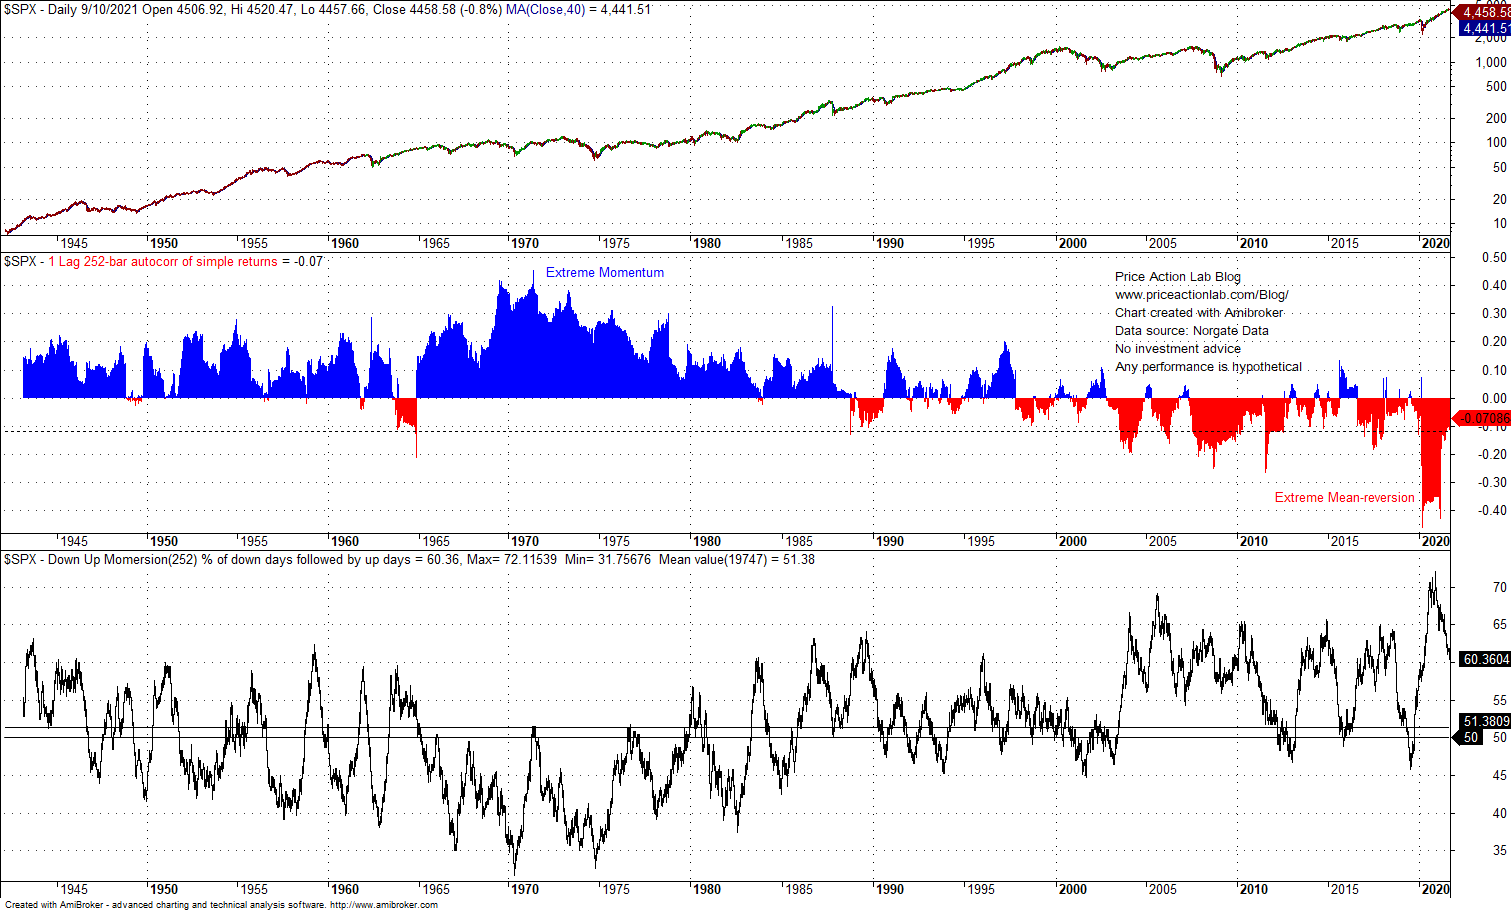
The autocorrelation dropped just below -0.40 after the March 2020 crash and that was an extreme level. In fact, for a period of about a year from March 2020 to March of this year, the autocorrelation stayed below -0.35. That was an extreme and prolonged dynamic. The autocorrelation has returned near neutral levels at -0.07 while the reversal was fast.
Note that the autocorrelation reached extreme positive levels in the 70s and then a regime change followed in the late 90s. Highly positive autocorrelation in daily returns is related to momentum and highly negative autocorrelation is related to mean-reversion in the following sense: the former means there is higher probability up(down) days will be followed by up(down) days and the latter means there is higher probability up(down) days will be followed by down(up) days. It is the dynamic of down days followed by up days more frequently that has resulted in a persisting uptrend since the March 2020 bottom.
Our Down UP Momersion Indicator illustrates this dynamic on the bottom pane of the chart. By December 9, 2020, the percentage of down days followed by up days in a rolling 252-day window surged to an all-time high of 72.1%. Never before in the history of the stock market since at least 1941 down days have been followed by up days at such a high frequency. This was the result of relentless buying of the dips by traders and investors.
Reflexivity amplifies mean-reversion: the more mean-reverting a market gets, the more traders buy the dips and as a result the market gets even more mean-reverting. However, in the S&P 500 case, after December 2020, mean-reversion started waning and as of the close of Friday, September 10, 2021, the percentage of down days followed by up days in 252-days has decreased to 60.4% from the all-time high of 72.1%. The market is returning to normal levels of mean-reversion and this transition may be problematic for bulls near all-time highs. This is because, as mean-reversion is waning, momentum is increasing. High momentum during a correction may amplify down moves and the depth of drawdown.
In conclusion, the fast reversal of mean-reversion to the mean this year increases the risks of an extended short-term correction in the stock market.
Disclaimer: No part of the analysis in this blog constitutes a trade recommendation. Read the full disclaimer here.
Charting and backtesting program: Amibroker. Data provider: Norgate Data
If you found this article interesting, you may follow this blog via RSS or Email, or in Twitter.
Price Action Lab premium Content: By subscribing you have immediate access to hundreds of articles. Premium Insights subscribers have immediate access to more than a hundred articles, Premium Articles and Market Signals subscribers have immediate access to hundreds of articles that include the trader education section and All in One subscribers have access to all past premium content. Click here for more details.

Price Action Lab Blog Premium Content


