


Long/short with extreme overbought/oversold equities has the potential of generating high returns because of large moves due to rebounds and corrections. This article outlines the process of generating long/short signals for equities with extreme overbought/oversold conditions.
There are two basic steps involved in generating long/short signals based on extreme overbought/oversold conditions:
- Filtering a stock universe for extreme overbought/oversold conditions
- Using the output of the filter with a suitable algo for generating long/short signals
Filtering a stock universe for extreme overbought/oversold conditions
There are many ways of quantifying extreme overbought/oversold conditions and selecting stocks. The simplest way involves using an oscillator such as the RSI. There are more advanced methods. Note that most indicators measure momentum and the assumption is that extreme levels during up moves correspond to overbought conditions and during down moves to oversold conditions. However, overbought stocks may become more overbought and oversold more oversold. This is why another step is required for identifying long/short candidates; some overbought stocks may be identified as longs and others as shorts. Likewise for oversold stocks.
Using the output of the filter with a suitable algo for generating long/short signals
The algo decides whether a stock is a long or short candidate. In the past, this was due to visual technical analysis. We now do this with machine learning. Below is a diagram that outlines the process.

For the input stock universe, we consider Russell 3000 constituents and then scan for candidate stocks based on proprietary criteria. We then use DLPAL LS software to generate long/short signals based on the output of the filter.
Below is an example of the results after the close of Friday, October 8, 2021.
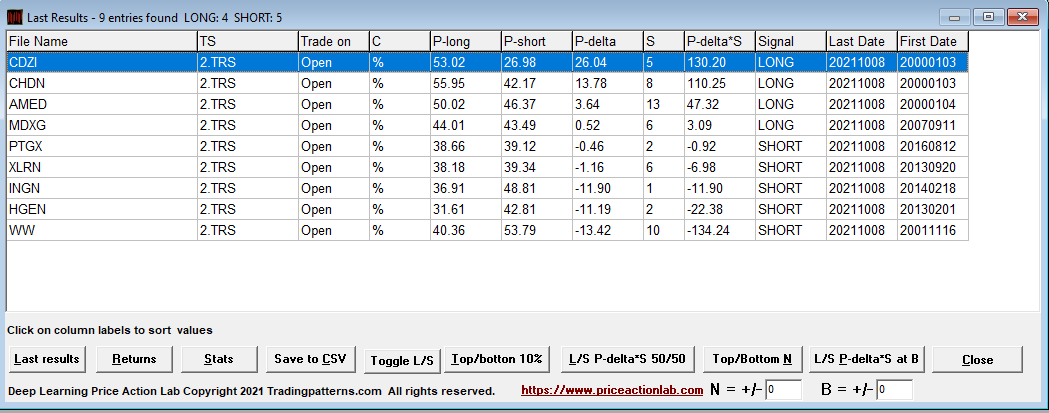
P-delta is P-long minus P-short and an indication of the short-term directional bias the next day from open to close. If P- delta is positive then the Signal is Long and if negative it’s Short.
In the above example, there are four long and five short stocks. In extreme cases, all signals may be long or short.
After the close of the last trading day of the week, in this case, Friday, October 15, 2021, we updated our data and calculated the (theoretical) performance from open to close of the above signals.
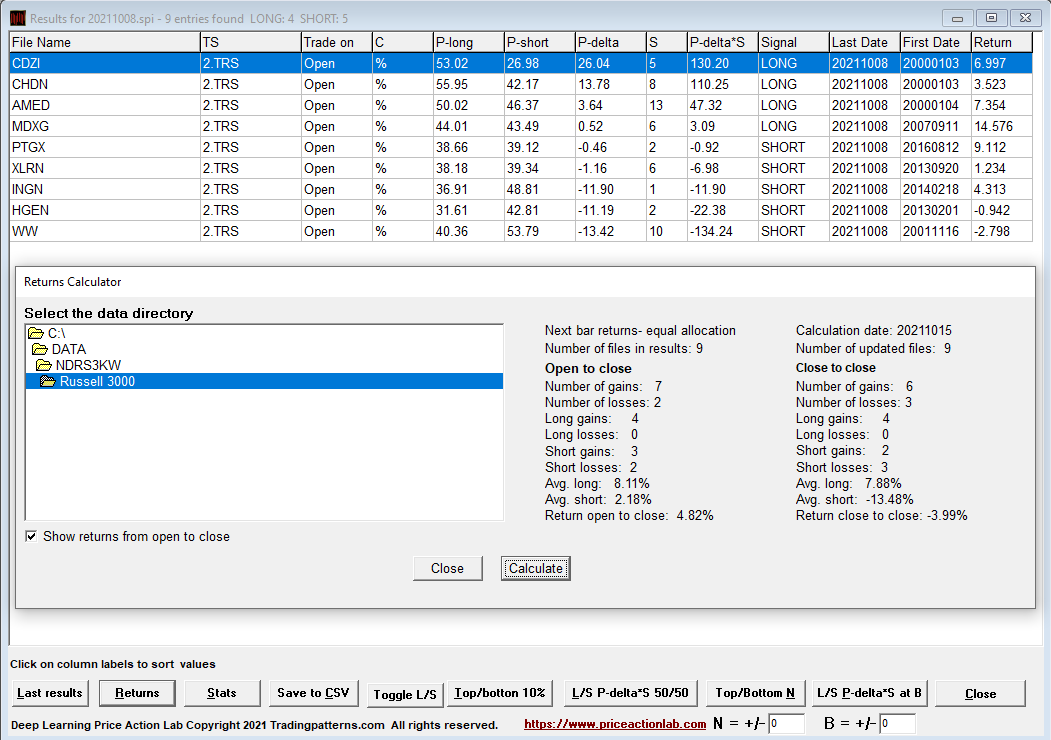
Four long stocks and three short stocks gained from open to close. The average gain of the nine stocks was 4.8%. There were some large moves in both long and short stocks.
There are many ways of filtering a universe of stocks using specific technical and even fundamental criteria and therefore there are also unlimited long/short analysis options. The above was just an example we use for our reports to our premium subscribers.
Also note that since our criteria for identifying overbought/oversold stocks may change from time to time and include a wide variety of indicators, backtesting this method is not possible. This type of analysis falls under what can be labeled as quant discretionary trading.
DLPAL LS software is available for sale to qualified professional traders and hedge funds. A fully functional trial is available at a fee. Click here for more details.
More details about DLPAL LS can be found here. For more articles about DLPAL LS click here.
Please read our Disclaimer and Terms and Conditions before ordering a demo or full version of DLPAL LS.


