


A long-short mean-reversion strategy for trading a portfolio of SPY, QQQ, and TLT ETFs.
The strategy rules are available for sale. Contact us for details.
For all backtests in this article, we used Norgate data. We highly recommend this data service (we do not have a referral arrangement with the company).

Timeframe: Daily (adjusted data)
Markets: SPY, QQQ, TLT
Strategy type: Long-short mean-reversion
Maximum positions: 3
Position size: equity/3
Commission: $0.005/share
All trades are executed at the open of the next bar
Backtest range: 01/2/2003 –12/29/2023
The strategy is not optimized for the highest annualized return.
Equity curve
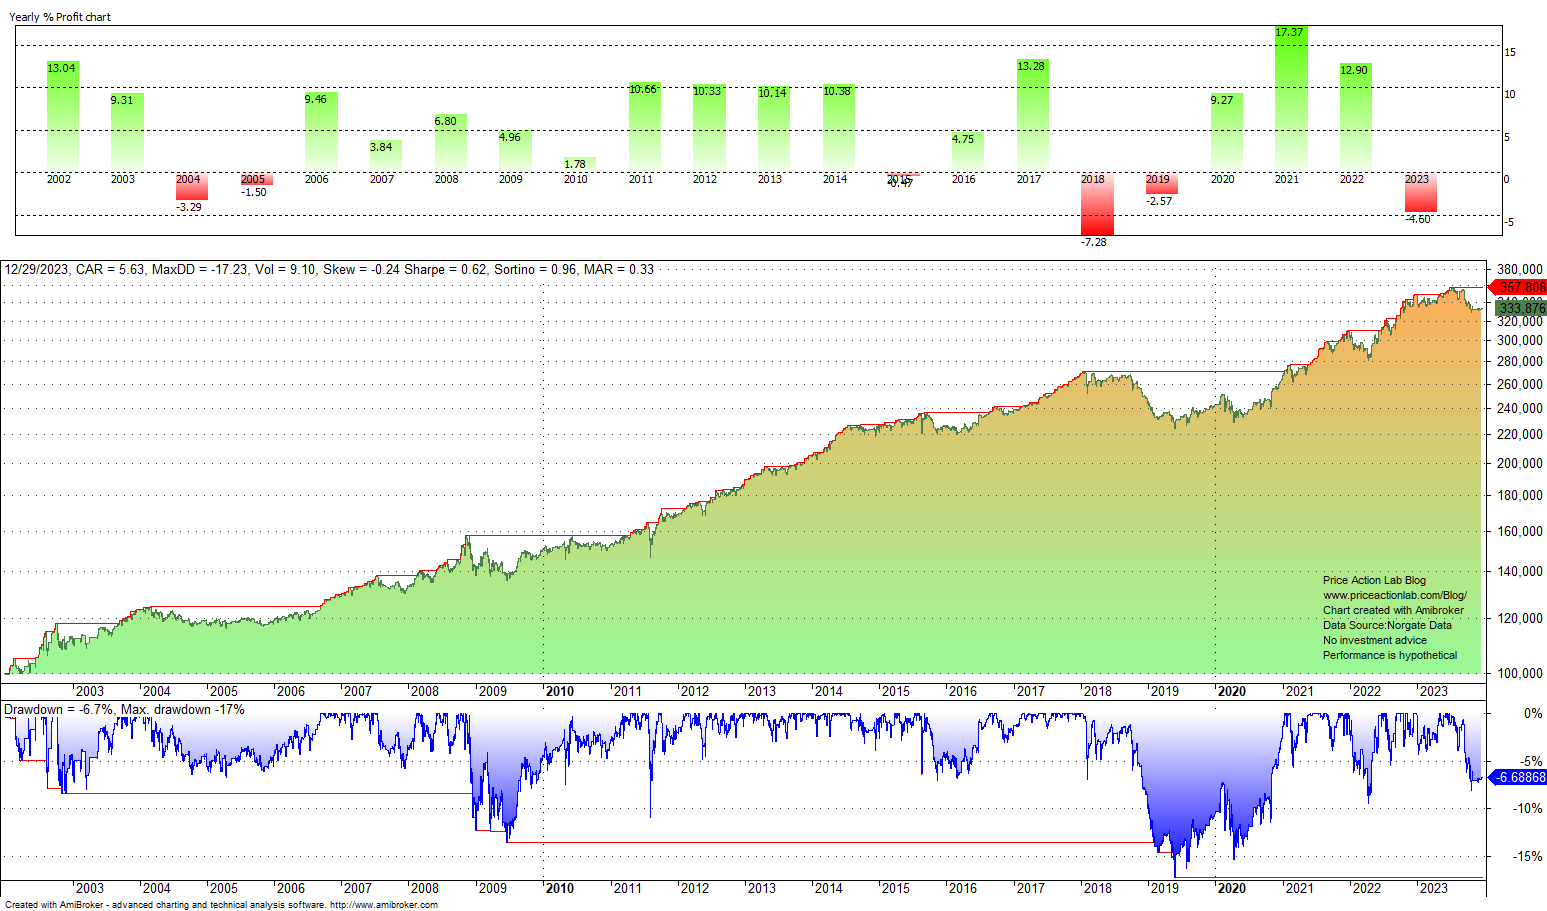
Performance Summary
| STRATEGY | |
| CAGR | 5.6% |
| MDD | -17.3% |
| VOLATILITY | 9.1% |
| SHARPE | 0.62 |
| TRADES | 1067 |
| LONG TRADES | 761 |
| SHORT TRADES | 306 |
| AVERAGE TRADE | 0.35% |
| PROFIT FACTOR | 1.50 |
| WIN RATE | 65.3% |
| AVG. BARS IN TRADE | 7.5 |
| EXPOSURE | 41.2% |
The strategy’s CAGR is 5.6%. The maximum drawdown of the strategy is 17.3%. The Sharpe of the strategy is 0.62 versus 0.34 for buy and hold in the same period. The volatility of the strategy is 9.1%. The average holding period is 7.5 days. The win rate is 65.2%.
Two ETF positions may also be held. In this case, the CAGR increases to 8.3%, but the maximum drawdown and the volatility increase to 21.2% and 12.6%, respectively.
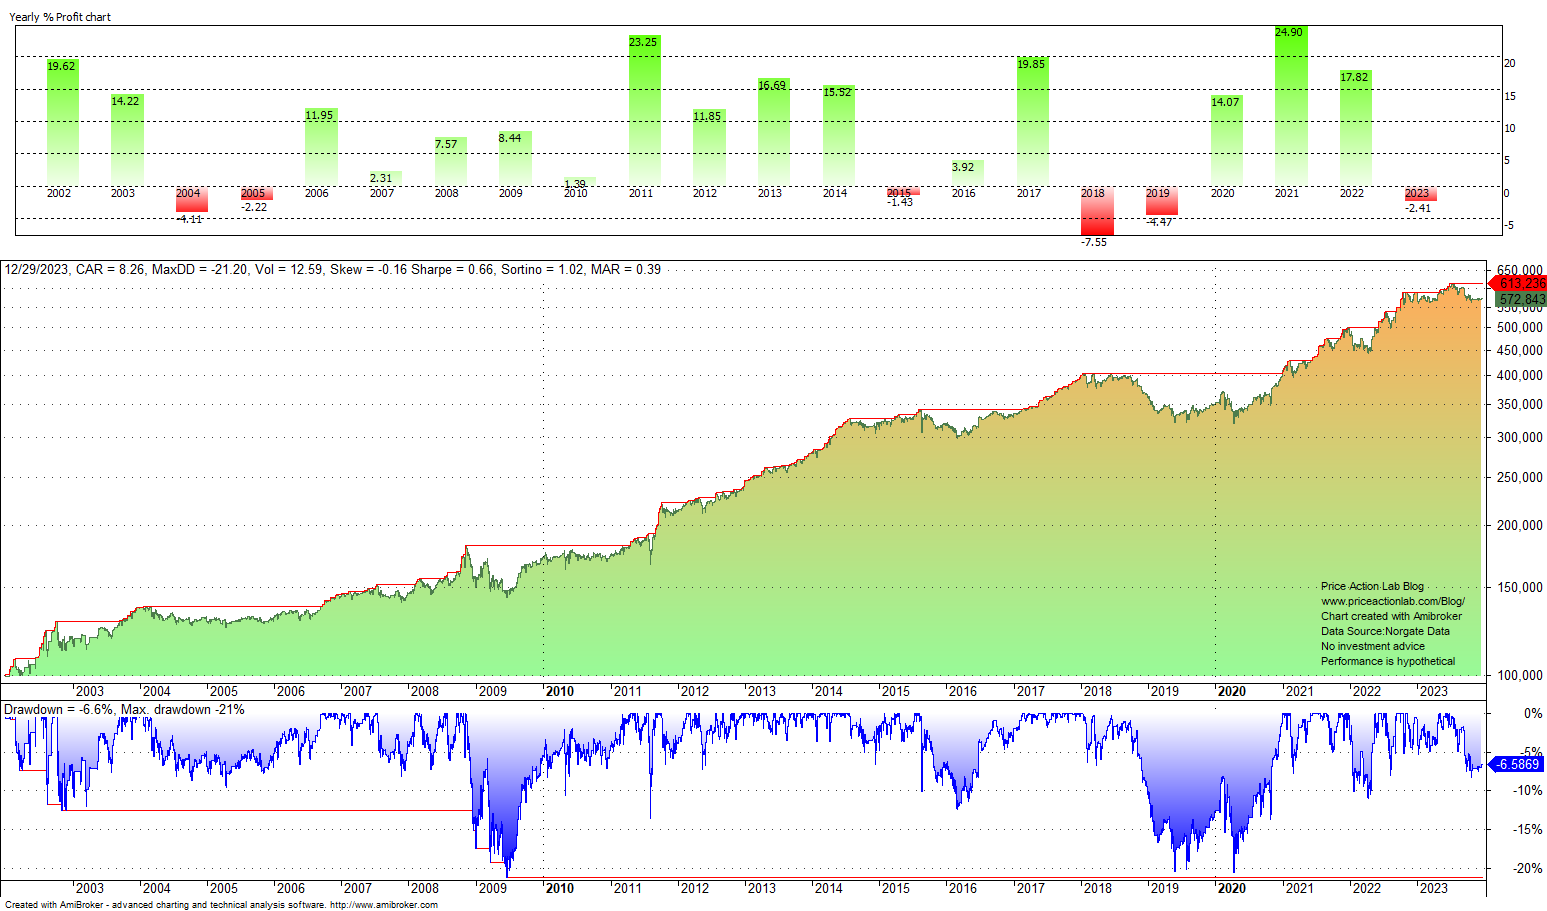
There have been six down years in the test period, with 2018 down the most at -7.6%. In 2008, the strategy was up 7.5%, and in 2022, it gained 17.8%.
The strategy rules are available for sale. Contact us for details.
|
This post is for paid subscribers
Already a subscriber? Sign in |
Click here for a list of strategies.
Disclaimer: No part of the analysis in this blog constitutes a trade recommendation. The past performance of any trading system or methodology is not necessarily indicative of future results. Read the full disclaimer here.
Charting and backtesting program: Amibroker. Data provider: Norgate Data
If you found this article interesting, you may follow this blog via RSS, Email, or Twitter


