


There are many risk management schemes with varying sophistication. This article lists seven of these schemes, ranked by increasing complexity.
There are two important parts to every successful trading and investment strategy:
- Timing Rules.
- Risk management.
In this article, we focus on the risk management aspect, which is the most important, according to many traders and investors. We list seven risk management schemes, ranked by increasing complexity.
Note, that timing and risk management are inextricably related. Often it is hard to draw a line between the two. Timing can be the risk management, and risk management can be the timing. From a strategy perspective, we try to separate the two for clarity. However, as complexity increases, it becomes evident that timing and risk management cannot be separated into two distinct parts of a strategy. This is when risk dictates timing, and in turn, timing determines risk. At the low complexity level, the separation of the two is easier, as shown below.
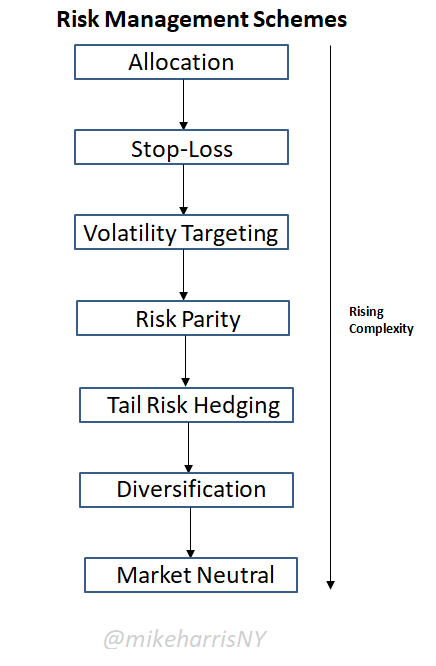
1. Allocation
This is the most basic risk management scheme and one that is a component of many other complex schemes.
The trivial allocation is 0%, i.e., being out of the market, and yielding 0% return. The allocation may be used at the individual trade level, but also at a multi-strategy level.
In addition, the allocation of capital to a single strategy may be used when risk control through the use of stop-loss is not possible, or suboptimal. For example, the profitability of mean-reversion strategies may be maximized with a full allocation of capital, and the use of stop-losses degrades performance. In this case, one can allocate a fraction of available capital to the strategy, and if the drawdown increases above a certain threshold, the strategy is stopped.
Allocation is also an integral part of diversification. Allocation is common sense, but the actual determination of the allocated capital can get sophisticated.
2. Stop-Loss
Determination of position size for single strategies requires an allocation to a signal in dollars, or a risk percent, and the stop-loss, either in points or as a percentage of bankroll.
As mentioned above, risk management with stop-losses cannot be used with all strategies. However, retail traders use a stop-loss strategy regardless of the type of signals that trigger the trades. In general, if the signals are generated by a trend-following strategy, then using stop-loss tends to decrease the win rate but increase the payoff ratio. The result is a high-profit factor and profitability.
In the case of mean-reversion strategies, the payoff ratio is usually low, and using a stop-loss reduces the win rate, pushing the profit factor near one, or even below it, and the strategy turns unprofitable.
Position size determination with stop-losses, either fixed or determined by volatility, has been presented as an innocent risk management scheme by many authors, but it is much more complicated, and its use may have generated more losses than gains for retail traders on average.
More details about the relationship between win rate, payoff ratio, and profit factor, as well as, position size determination formulas when stop-losses are used, can be found in my free book, Profitability and Systematic Trading (Wiley, 2008).
3. Volatility Targeting
Volatility has an association with risk, and targeting the former can help control the latter.
Volatility targeting is in principle a simple notion, although the application can be sophisticated. If volatility rises, the exposure to the market is reduced, and if volatility falls, the exposure is increased.
The simplest way to target volatility, although the target is not directly controlled, is by exiting the market when it becomes volatile. In the case of the stock market, examples are when the S&P 500 falls below the 200-day moving average, or VIX increases above a certain level. These rules tend to decrease the volatility of the equity curve, but usually at the expense of longer-term absolute returns.
There are advanced schemes of volatility targeting that can generate leveraged alpha. There are also methods for dynamic volatility targeting. In multi-asset trading, volatility targeting plays a decisive role in performance.
4. Risk Parity
Risk parity uses a risk target to determine the optimal allocation to different asset classes. The solution usually involves dynamic leverage, or deleverage, as well as, short-selling. This approach takes the simple allocation scheme to a mathematical level. Instead of allocating capital, this scheme allocates risk to multiple assets. The objective is a minimum risk portfolio where the contribution of all assets to the risk is the same. The mathematics are appealing, but the effectiveness of the scheme has been questioned.
5. Tail Risk Hedging
Tail risk hedging has gained popularity in the last few years, especially after the 2020 crash. The idea is simple in principle in the case of equity investors: maintain a full allocation, and purchase some form of protection from adverse events arising from the left tail of the returns distribution. The protection is usually out-of-the-money puts or collars.
Tail risk hedging is another scheme for risk management, but it can become expensive because it essentially pays for insurance. Simple schemes include the Cboe S&P 500 5% Put Protection IndexSM (PPUT).
The Cboe S&P 500 5% Put Protection IndexSM (PPUT) tracks the value of a hypothetical portfolio of securities (PPUT portfolio) designed to protect an investor from negative S&P 500 returns. The PPUT portfolio is composed of S&P 500® stocks and of a long position in a one-month 5% out-of-the-money put option on the S&P 500 (SPX put). Source: CBOE
The relative performance of PPUT and SPY from 01/04/2010 to 07/26/2022 shows a gross underperformance of the former.
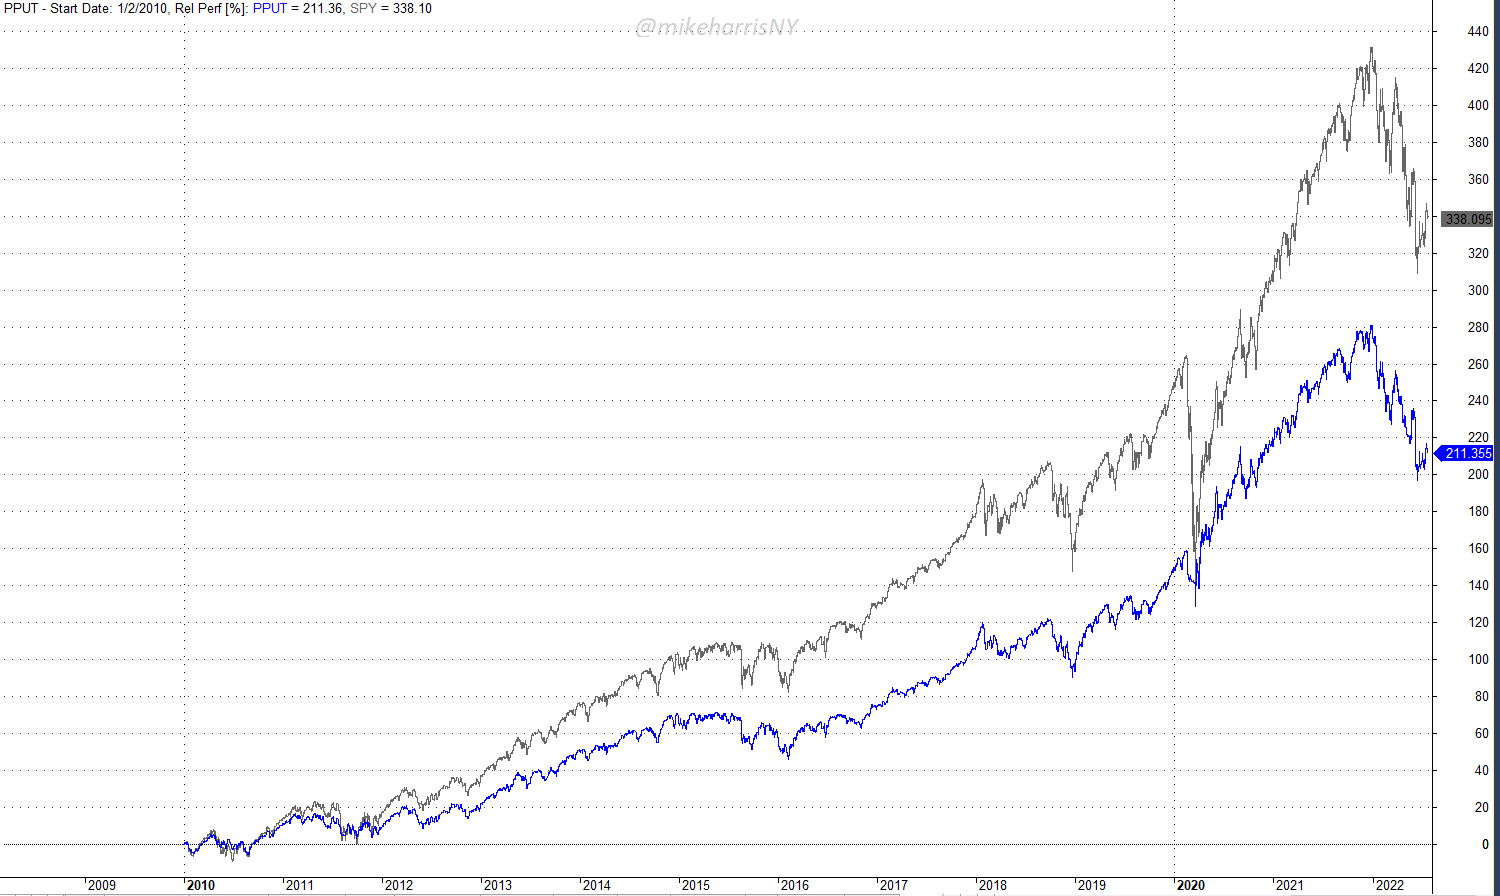
It may be seen that although during the 2020 crash the protection worked, this insurance comes at the detriment of long-term performance.
Tail risk hedging has the potential of providing leveraged alpha, but the timing of options trades is important.
6. Diversification
Diversification in different assets and with different strategies is a common sense idea. But in reality, diversification is hard to achieve efficiently due to a real shortage of purely non-correlated assets and strategies.
For example, the standard 60/40 portfolio allocates 60% in stocks and 40% in bonds, often with annual rebalancing. However, the correlation between stocks and bonds is dynamic. Below is a chart of the 0-lag, 120-day correlation of SPY and AGG ETFs.
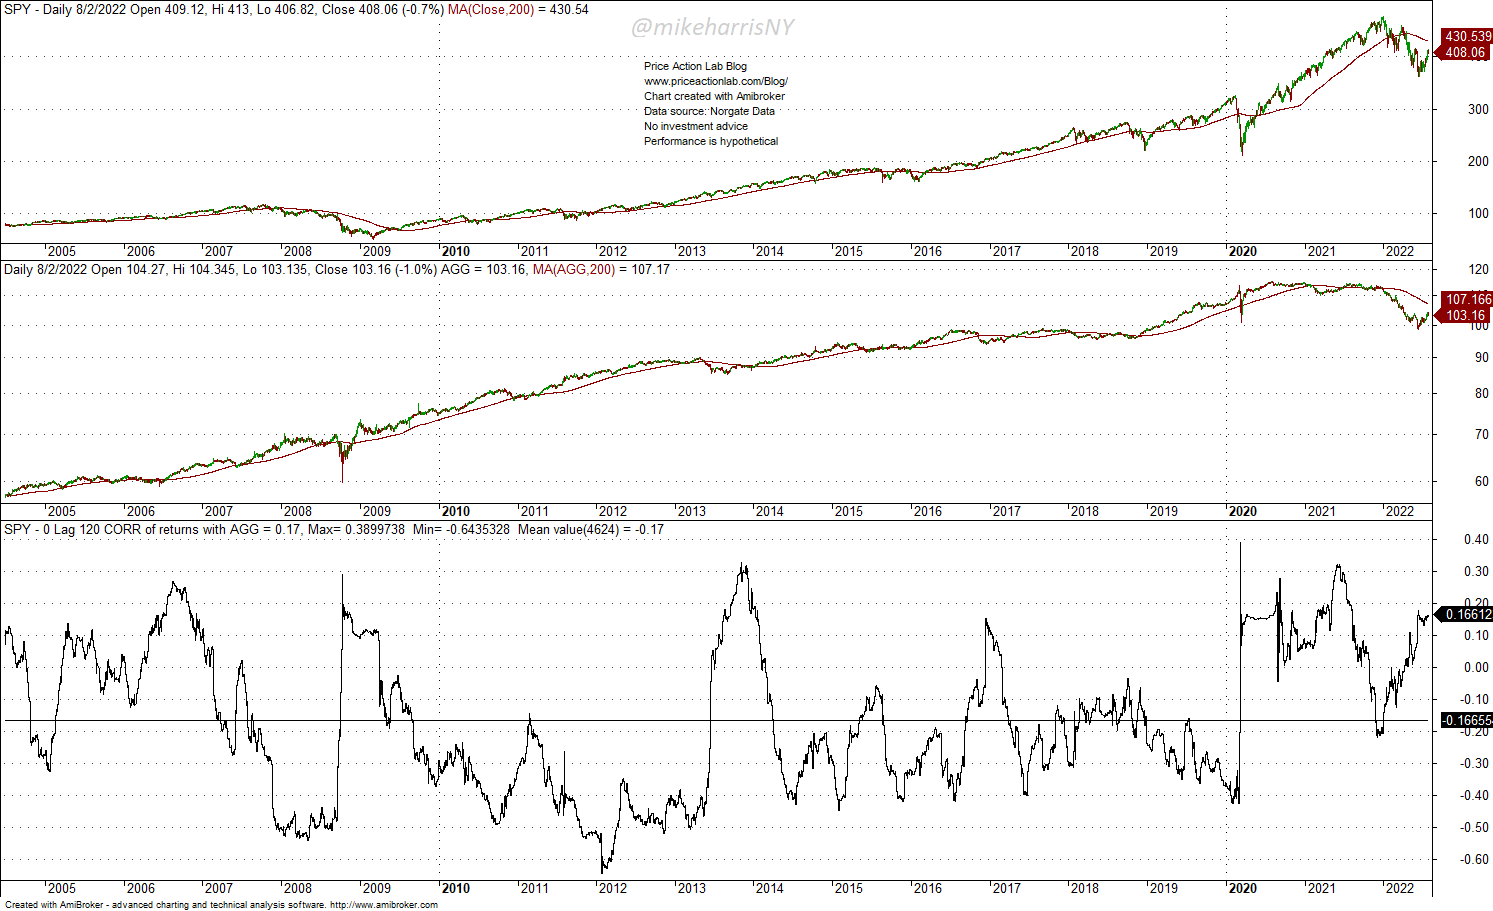
Although the mean 120-day correlation is -0.17, there have been wide swings from around +0.40 to below -0.60. Risks can increase when stocks and bonds are correlated and they are on a downtrend, and this is what happened this year, with the 60/40 portfolio in SPY and AGG falling more than 18% in June. In 2008, this portfolio lost 19% due to the rising correlation between stocks and bonds.
For our weekly systematic signals, we use six strategies and several markets. There is one tactical allocation strategy with price series momentum, two cross-sectional momentum strategies, two mean-reversion strategies, and one equity long-short strategy. For allocation, we use the 1/N rule; in this case, N = 6, and for allocation to signals, we also use the same rule. A more rigorous approach would allocate according to modern portfolio theory, but in practice, the performance gains are marginal. Choosing the right strategies for diversification is way more important than any deviation from the simple 1/N rule. However, if there is a “spoiler” strategy, i.e., one with extreme left tail losses, then 1/N is a suboptimal allocation. Therefore, the use of 1/N assumes strategies stay away from the tails.
CTAs have also played an important role in providing diversification and convexity to equity portfolios in the past, but there are questions about whether these advantages have endured through time. This has been a good year for CTAs due to trends markets and especially commodities, but we have to wait until year-end to see the final results.
7. Market Neutral
Market neutral is the ultimate risk management scheme. It is also the most complicated because it involves trying to generate a return in both up and down markets while minimizing risk.
Zero beta positioning that profits irrespectively from the market direction is a nice theoretical idea but extremely hard in practice. It sounds nice to have a strategy that profits regardless of market direction while being uncorrelated with the broader market. But in reality, there may be surprises.
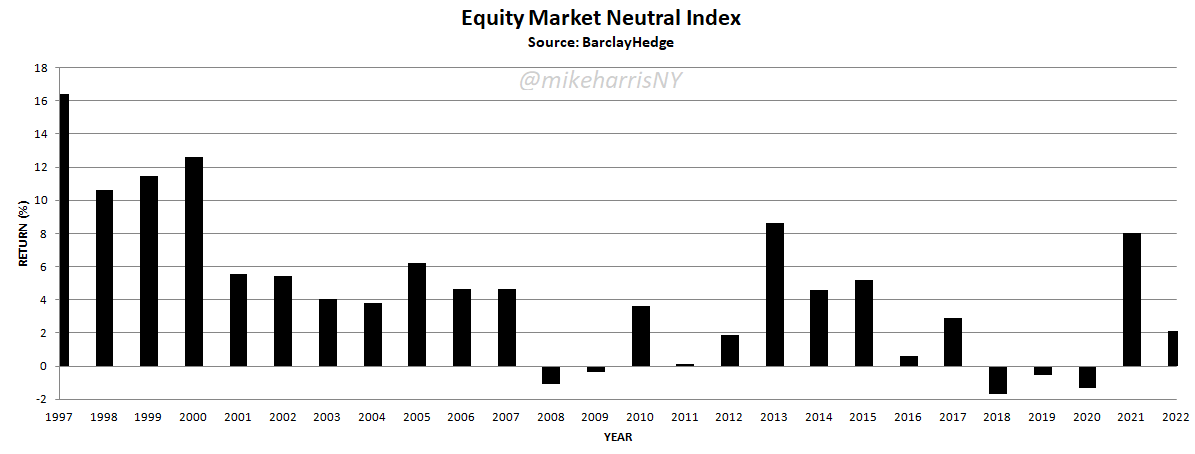
Market neutral has underperformed the equity markets on an absolute return basis but has outperformed on a risk-adjusted basis. The above chart shows long periods of underperformance but the annualized return is about 4.5% and Sharpe is 1. This performance makes the scheme candidate for a leveraged alpha generation but there is a catch: the high returns that have contributed to a high Sharpe came before 2000 and afterward the scheme has been struggling.
Specifically, from 2018 to 2000, the scheme generated three consecutive losing years. The next year, 2021, was good for market neutral, and it remains to be seen how it is going to finish his year.
There is some confusion in the literature between dollar-neutral and market-neutral strategies. A dollar-neutral long-short strategy does not guarantee uncorrelated returns. A lot more is required to turn a dollar-neutral scheme into a market-neutral. One of the conditions appears to be a high number of long and short positions. Generating all those positions and managing the portfolio is beyond the capabilities of the average trader or investor. However, if the scheme works, it can deliver a relatively high annualized return and very low volatility and the Sharpe ratio is high.
Summary
I listed seven schemes for risk management according to rising complexity. There are possibly several other schemes available for achieving the most important objective of trading and investing:
minimize risk while maximizing return
Retail traders use mostly simple allocation and stop-loss schemes while hedge funds use quantitative methods, including volatility targeting, risk parity, diversification, and market neutral strategies. Some retail traders and funds also use tail risk hedging as insurance from adverse developments. Trading and investing are all about timing and risk control. The objective is to realize the maximum possible return at the minimum possible risk.
Disclaimer: No part of the analysis in this blog constitutes a trade recommendation. The past performance of any trading system or methodology is not necessarily indicative of future results. Read the full disclaimer here.
Charting and backtesting program: Amibroker. Data provider: Norgate Data


