


This is a trend-following strategy for trading futures contracts in the daily timeframe, with a brief discussion of the risks and limitations
For all backtests in this article, we used Norgate data. We highly recommend this data service (we do not have a referral arrangement with the company). Updated: December 29, 2023

Timeframe: Daily (continuous back-adjusted contracts).
Markets: 23 futures contracts (Brent Crude oil, Crude oil, Cocoa, E-Mini S&P 500, Euro-BTP Long-term, Dax, Euro STOXX 50, Euro-Bund, Gold, Feeder Cattle, Lean Hogs, Copper, Coffee, Live Cattle, Frozen Concentrated Orange Juice Grade A, Palladium, Platinum, Silver, Corn, 10-Year U.S. T-Note, Chicago SWR Wheat, Euro-Buxl, US Dollar Index).
Strategy type: Trend-following based on breakouts, stop and reverse.
Maximum positions: 23, long/short.
Position size: based on stop-loss and maximum risk per position.
Trade entry: All trades are executed at the open of the next bar.
Backtest range: 01/3/2000 –12/29/2023
The strategy is not optimized for the highest annualized return. The entries and exits are based on price breakouts. The breakout lookback period is not optimized, but it is based on the popular length used by trend-following CTAs.
Equity Curve, Drawdown Profile, and Yearly Returns
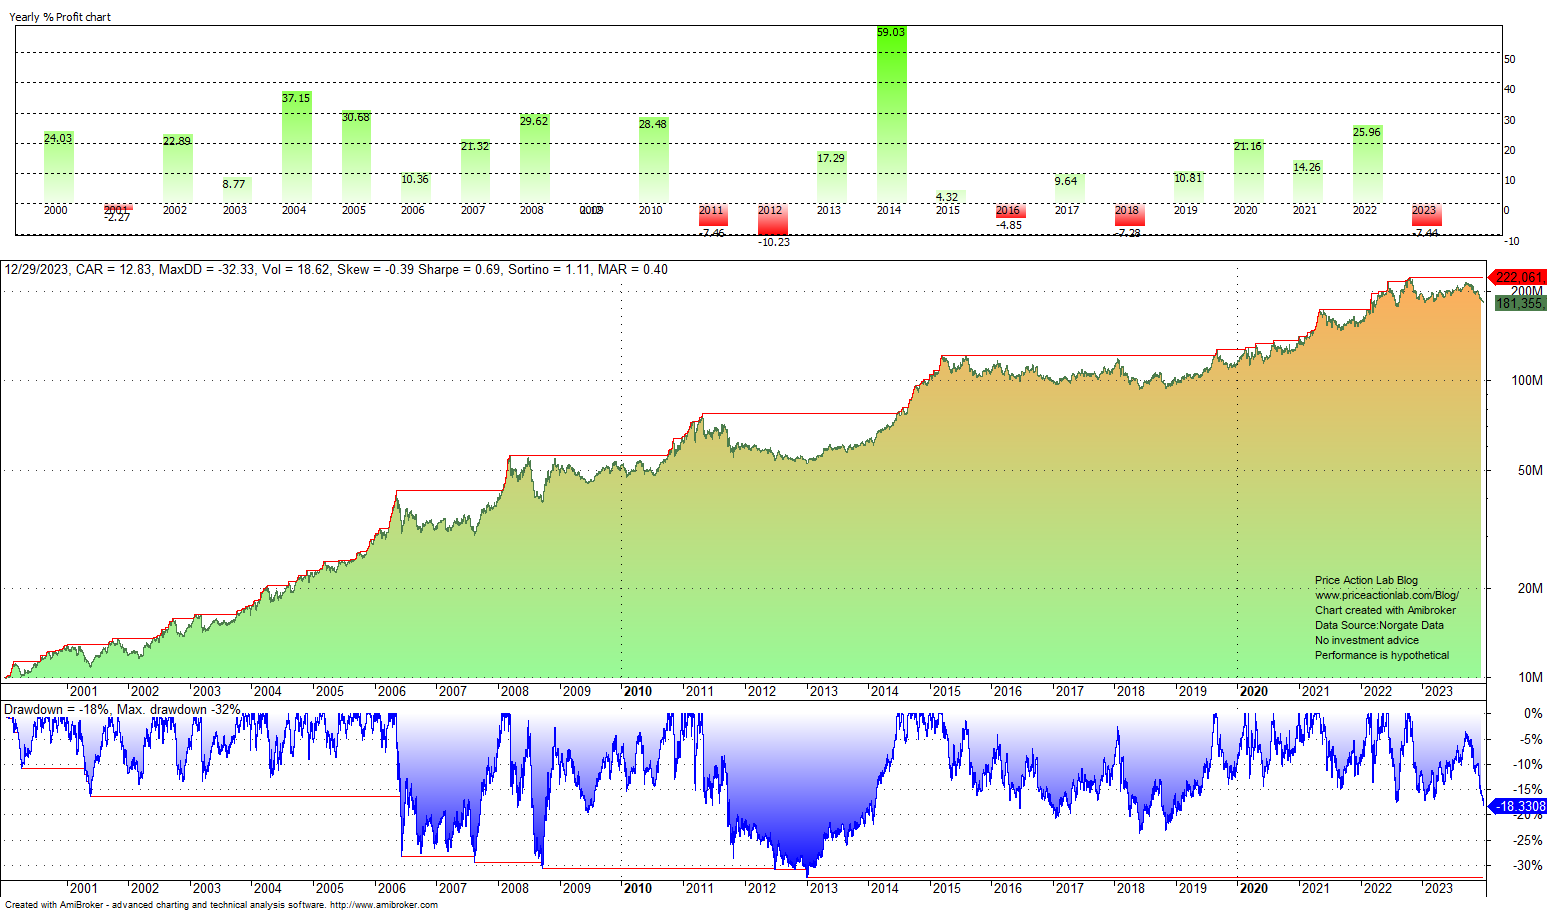
The annualized return is 12.8%, and the maximum drawdown is 32.3%. Since 2000, there have been six down years, with the largest loss of 10.2% in 2012. The strategy provided a hedge during the dot-com and GFC bear markets. In 2014, the strategy gained nearly 59%. In 2022, the strategy was up 26%.
Performance Summary
| STRATEGY | |
| CAGR | 12.8% |
| MDD | -32.3% |
| VOLATILITY | 18.6% |
| SHARPE | 0.69 |
| TRADES | 956 |
| LONG TRADES | 503 |
| SHORT TRADES | 453 |
| AVERAGE TRADE | 21.2% |
| PROFIT FACTOR | 1.59 |
| WIN RATE | 18.2% |
| AVG. BARS IN TRADE | 102.4 |
| EXPOSURE | 64.8% |
The strategy Sharpe ratio is 0.69, which is more than double the SPY ETF buy and hold Sharpe ratio for two-thirds of the exposure in the same period.
Monte Carlo Simulation

According to the Monte Carlo simulation results, there is a 5% chance the maximum drawdown will be larger than 57% and a 1% chance it will be larger than 66%. (Caveat emptor: Monte Carlo analysis has limitations.)
Average Monthly Returns Chart
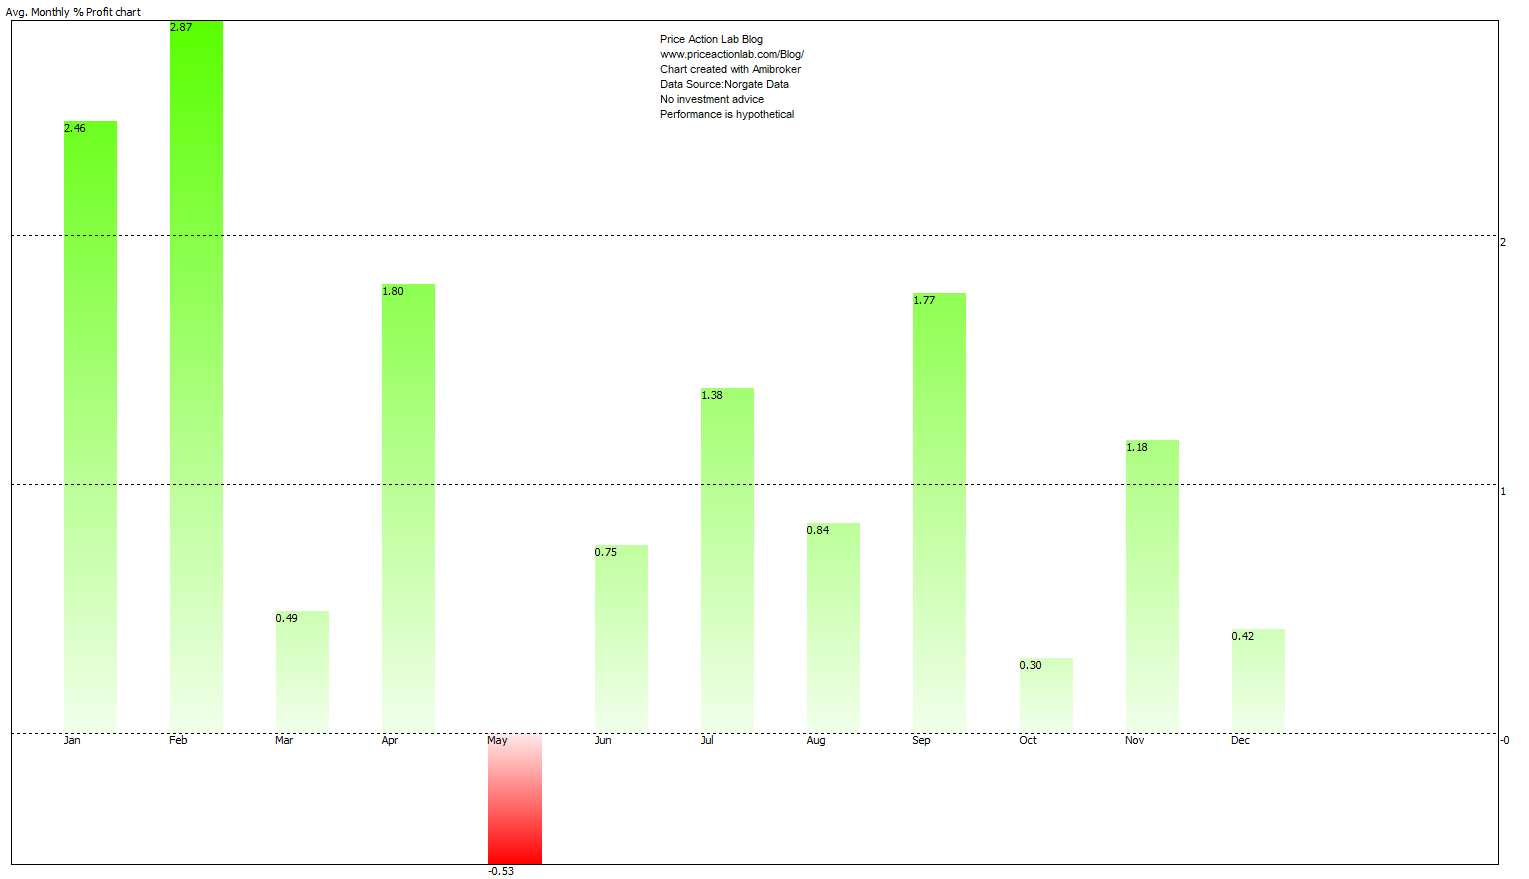
March, May, June, and October have underperformed on average. May has been a negative month. There appears to be strong seasonality in the first two months of the year, on average.
Rules of the strategy
The rules of the strategy are available for sale. Contact us for details.
The rules included below are sufficient for implementing the strategy in a backtesting or trading platform.
|
This post is for paid subscribers
Already a subscriber? Sign in |
The Risks of Trend-Following Strategies
Trend-following strategies attempt to capture long-term market trends, also known as outlier trades. The implementation of stop-losses results in a low win rate, as the strategies exit with a loss until the onset of a trend. This style of trading is hard and could lead to a loss of discipline.
Trends and trend-following are not the same thing, and many confuse the two. A trend-following strategy will not identify trends where there are none. From 2004 to 2016, or 13 years, the annualized return of the top 20 CTAs was 2.4%. However, the dispersion in CTA returns is high, and it is not reflected in the averages. There is a high specific risk in choosing a CTA or a trend-following strategy.
Furthermore, proper execution of trend-following strategies with many futures contracts requires sufficient capitalization. For about 20 contracts, the approximate initial capital is probably around a million dollars. Otherwise, due to insufficient capital, a strategy could miss a few profitable trends, negatively impacting the Sharpe and MAR ratios.
Disclaimer: No part of the analysis in this blog constitutes a trade recommendation. The past performance of any trading system or methodology is not necessarily indicative of future results. Read the full disclaimer here.
Click here for a list of strategies.
Disclaimer: No part of the analysis in this blog constitutes a trade recommendation. The past performance of any trading system or methodology is not necessarily indicative of future results. Read the full disclaimer here.
Charting and backtesting program: Amibroker. Data provider: Norgate Data
If you found this article interesting, you may follow this blog via RSS or Email, or on Twitter


