


The skewness of trading strategies is an important statistic, but it makes sense when measured properly and analyzed in the proper context.
What is skewness?
Skewness is a measure of the symmetry of a distribution. If a distribution is normal, the skewness is zero. Negative values of the skewness mean that the distribution is skewed to the left, while positive values indicate a right skew. Usually, left skew means that the left tail is longer than the right, and positive skew means the right tail is longer than the left.
How to measure the skewness of trading strategies?
The simplest way to measure the skew of a trading strategy is to export the data to Excel and use the SKEW function. But what is the proper series to use?
In my opinion, the proper series to use for the calculation of skewness is the trade percent profit or loss. This is because what we are after when we are developing trading strategies is a distribution of trade returns with the highest possible skew.
A high positive skew of the trade profit distribution means that the strategy generates trades with large profits and the traders with losses remain relatively small. Theoretically, this is what we are after, but it is not always possible.
For example, trend-following systems with long holding periods in the order of weeks or months generate many small losers and occasionally very large winners. These strategies usually have a high skewness. However, high skewness comes at the expense of a low win rate for those strategies.
On the other hand, mean-reversion strategies tend to generate many small winners but occasionally are hit with large losers. For this reason, these strategies have negative skewness. But these strategies usually have a high win rate.
Misconceptions about skewness and The Holy Grail of Trading
The Holy Grail of trading, or something close to it, could be a strategy with the following parameters:
Skewness > +2
Win rate > 67%
Holding periods < 10 days
Annualized return > 12%
Maximum drawdown < 20%
Although some astute quants may have something close, for the majority of traders, trying to develop a strategy with the above performance parameters will lead to curve-fitting and eventually losses. Eliminating the constraints imposed by the convergence-divergence (mean reversion versus trend-following) trade-off is nothing trivial. There are claims that a few funds have achieved this level. I am not sure. I will have to analyze the performance, and the series is usually not public or even kept secretive.
Examples (backtests)
Below is an example of a trend-following strategy based on our PSI5 algorithm in divergent mode. The strategy trades 23 liquid futures.
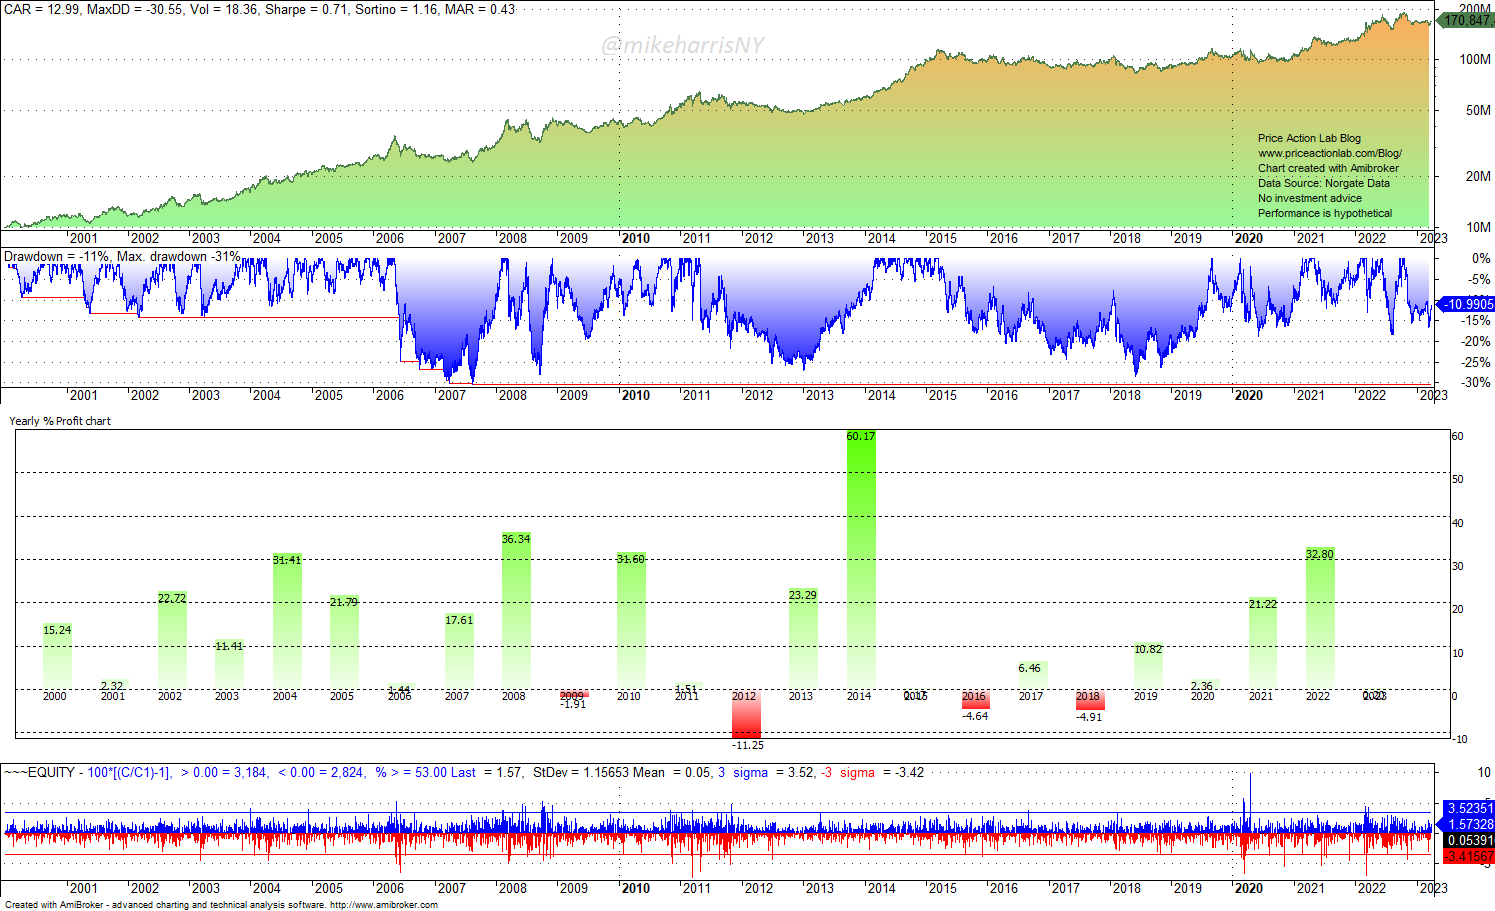
The annualized return is 13%, but the maximum drawdown is 30.5%. The skewness is +3.8, and it is high due to the trend-following nature of the strategy, i.e., many small losers and occasional very large winners. The win rate is 20%. The average holding period is about 100 days.
Below is an example of a mean-reversion long-only strategy for the SPY ETF with the same PSI5 algorithm but in convergent mode.
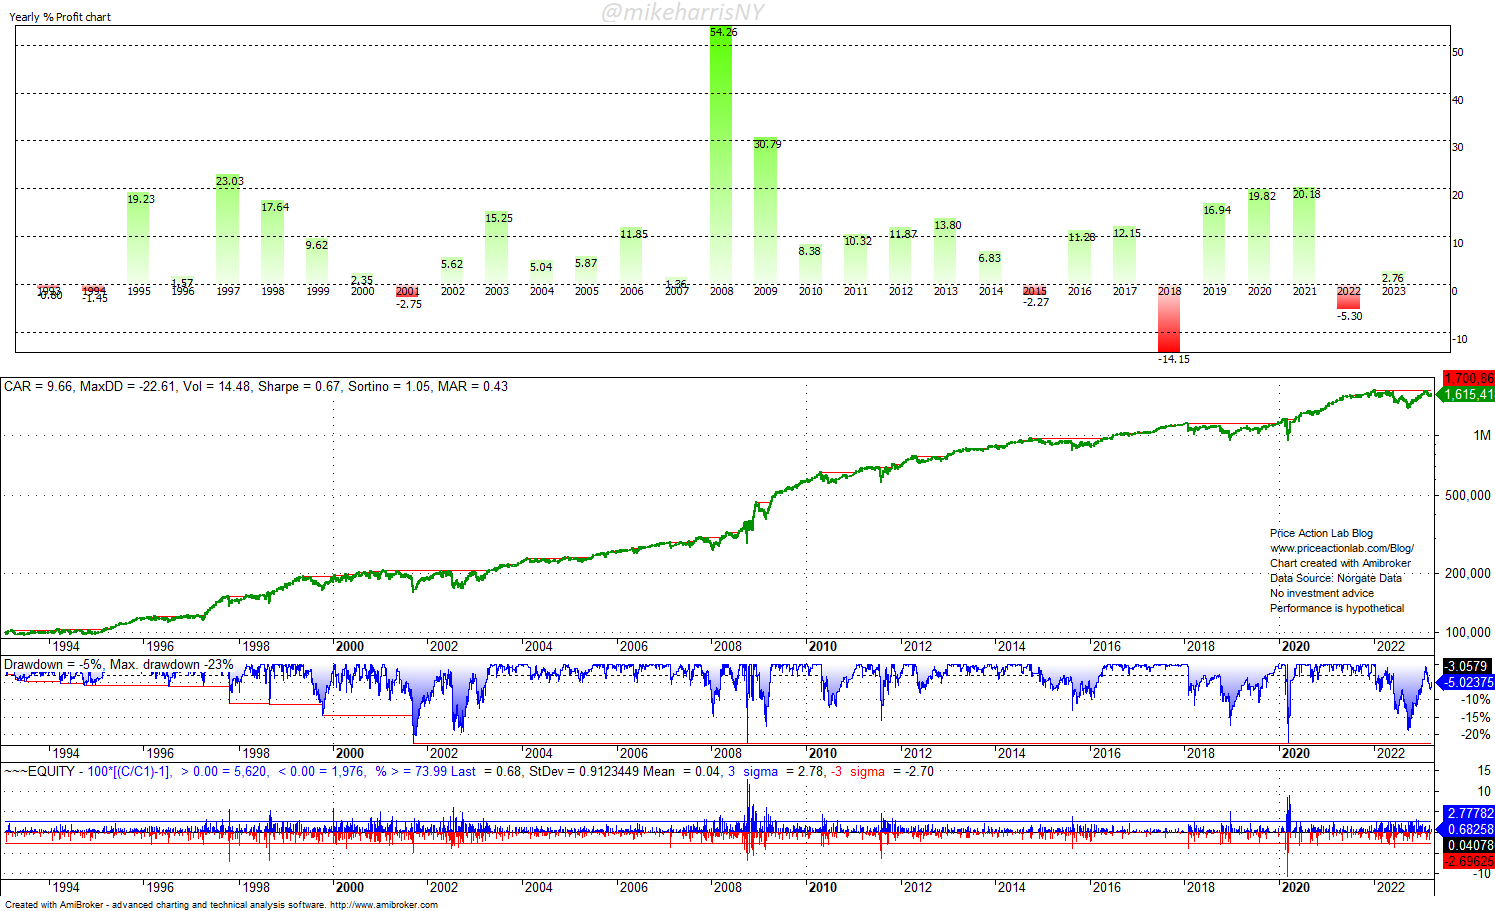
The annualized return is 9.7%, and the maximum drawdown is 22.6%. The skewness is -1.4, and it is negative due to the mean-reversion nature of the strategy, i.e., many small winners and occasional large losers. The win rate is 67.7%. The average holding period is about 4 days.
Which strategy do you prefer? I like them both because they are compliments. The correlation is close to 0.
Summary
Trading strategies pose formidable trade-offs. Strategies with high skewness usually have low win rates and long holding periods. Skewness is an important parameter, but it is not the only one to use when judging the performance of strategies. Those looking for high skewness and high win rates at a low maximum drawdown are essentially looking for the Holy Grail of trading.
Premium Content
Online Books
Premium Articles
Systematic Market Signals
By subscribing you have immediate access to hundreds of articles. Premium Articles subscribers have immediate access to more than two hundred articles and All in One subscribers have access to all premium articles, books, premium insights, and market signals content.
Free Book
Subscribe for free notifications of new posts and updates from the Price Action Lab Blog and receive a PDF of the book “Profitability and Systematic Trading” (Wiley, 2008) free of charge.
Disclaimer: No part of the analysis in this blog constitutes a trade recommendation. The past performance of any trading system or methodology is not necessarily indicative of future results. Read the full disclaimer here.
Charting and backtesting program: Amibroker. Data provider: Norgate Data


