


All investing and trading strategies can become chaotic and eventually cause high losses or ruin, but simpler ones can offer higher chances of longer periods of stability and profitability.
The Curse of Dimensionality
Richard E. Bellman, who invented dynamic programming, coined the term. When I studied dynamic programming in graduate school in the late 1980s, I found it somewhat counterintuitive but also intriguing. The idea that reaching a final goal could involve accepting a series of undesirable intermediate losses contradicted other optimization methods based on minimizing losses at every step and also the time horizon. For most real-world complex problems, dynamic programming can offer a solution that is “optimal” in some sense, whereas other theoretical methods that promise higher optimality may eventually fail.
As dimensionality increases, the number of dimensions increases, and the space grows exponentially. This results in the available data occupying less space, i.e., becoming sparse. This makes it impossible to identify statistically significant patterns, and the results are highly likely spurious correlations.
There is another problem rarely discussed in articles about the curse of dimensionality: beyond a certain point, the volume of the available space starts to shrink rapidly, and as the dimensions increase, it asymptotically converges to zero.
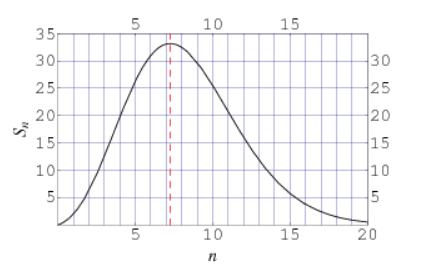
Source: Wolfram.com
The hyper-surface area of a unit-n-hypersphere peaks at around 7 dimensions and then asymptotically shrinks to zero as the dimensions n increase. For more than 20 dimensions, all the volume is concentrated at the surface of the n-hypersphere. More importantly, all possible solutions are extreme. This has profound ramifications for political, economic, and social systems, as I discussed in my 2018 M4 conference presentation (slides 27-32).
The Curse of Dimensionality and the Markets
In the real world, trading and investing are complex activities that require people to be willing to lose money. But people often try to avoid losing money by adding more variables, more filters, more types of investments, and more complexity. This tends to further increase the probability of ruin. It may sound paradoxical, but accepting losses eventually leads to profitability.
Some traders, for example, say that adding more markets to a trend-following strategy makes it more likely that an “outlier” trade will be profitable. At the same time, the chances of a hit due to a market-specific flash crash increase significantly, especially when the securities from the equity markets are added.
“Keep it simple, stupid” (KISS) is probably one of the least appreciated principles in trading and investing. By putting their money in index funds or a simple 60/40 portfolio, investors try to avoid the higher-dimensionality risks and possibly chaotic behavior of strategies. This does not mean there will not be losses, as the performance of the 60/40 portfolio showed last year. This is where the role of an astute adviser is important to mitigate the losses while maintaining low complexity and minimizing the risk of ruin in the future.
Traders tend to add more filters, more rules, more markets, and even more strategies in the hope that this will result in better performance. In reality, all these factors increase the probability of failure. There are multiple “sweet points” and also reasons for not adding filters, for example, to avoid bear markets but instead to try to take advantage of them. A strategy that behaves well during bear markets can offer higher convexity due to positive skew. Managed futures have offered this positive skew so far, but at the expense of a protracted extra-low performance period, known as the Lost Decade, from 2009 to 2018. This means that managed futures cannot be the only strategy in a portfolio. The proper, or optimum,” mix of strategies is a challenging problem for professionals with skin in the game.
The Curse of Dimensionally and the Perils of Backtesting
Due to high hidden dimensionality, most trading strategies that are developed via backtesting tend toward chaotic behavior. This is due to the non-stationary nature of the market price series and regime changes. Some strategies are lucky and stay profitable longer and this offers the illusion of sound practice. However, backtesting is a very dangerous practice: as the number of backtests increases, the probability of arriving at a spurious result that passes all conceivable validation tests tends to 1. Avoiding the failure that is due to the curse of dimensionality and the non-stationary nature of markets is a challenging task that only a few strategy developers can deal with. This is part of the edge and keeping it simple is important.
KISS
Simpler investing and trading strategies have higher chances of success, as compared to more complicated and fancier ones, especially when they can provide convexity during periods of turmoil. The balance is delicate because a higher weight to strategies that provide convexity during bad times negatively affects profitability during good times for equities. Nevertheless, simplicity must be the guiding principle in both trading and investing to avoid the curse of dimensionality.
Premium Content
Online Books
Premium Articles
Systematic Market Signals
By subscribing you have immediate access to hundreds of articles. Premium Articles subscribers have immediate access to more than two hundred articles and All in One subscribers have access to all premium articles, books, premium insights, and market signals content.
Free Book
Subscribe for free notifications of new posts and updates from the Price Action Lab Blog and receive a PDF of the book “Profitability and Systematic Trading” (Wiley, 2008) free of charge.
Disclaimer: No part of the analysis in this blog constitutes a trade recommendation. The past performance of any trading system or methodology is not necessarily indicative of future results. Read the full disclaimer here.
Charting and backtesting program: Amibroker. Data provider: Norgate Data


