


Classic trend-following appears to work well even without stop-losses, but the drawdown is higher.
Classic trend-following involves one entry signal, one exit signal, and a stop-loss. According to some trend-followers, you do not need additional plumbing for trend-following; the classic method is the best. I tend to agree based on my research.
Classic trend-following also works without a stop-loss: one entry signal and one exit signal. We will call this “basic trend-following.” There are some interesting trade-offs when transitioning from classic to basic trend-following. Let’s look at a few examples.
Example 1. PSI5 algo in divergent mode with 23 futures contracts (click here for more details). Backtest period: 01/03/2000 – 04/26/2023
Case 1: Strategy includes a stop-loss
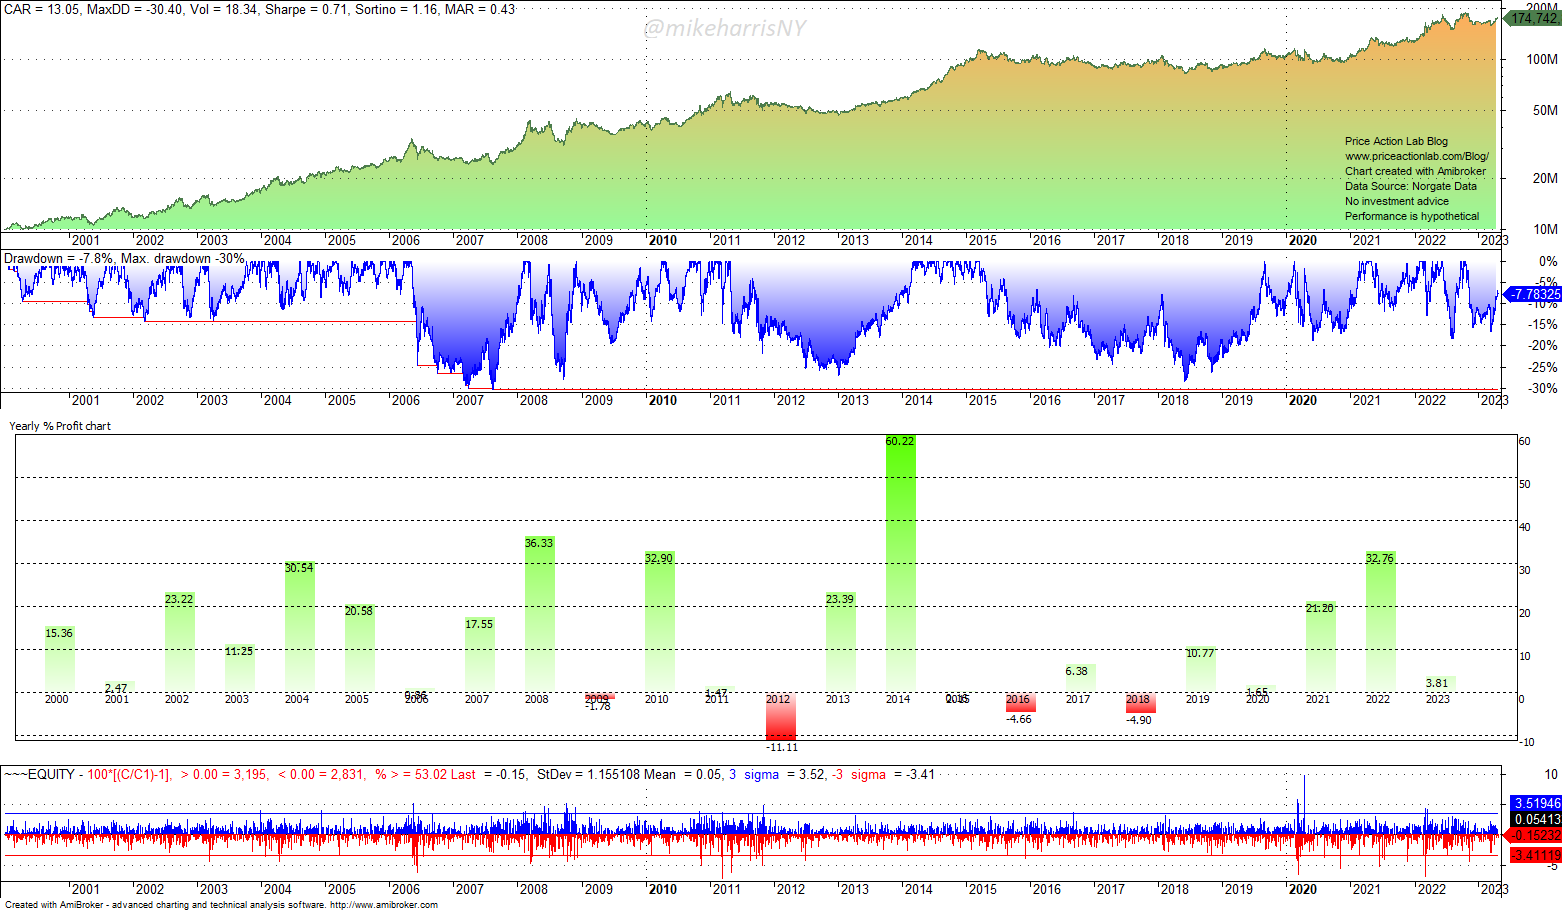
The above chart shows the equity curve, drawdown profile, yearly returns, and daily returns histogram of classic trend-following based on our PSI5 algorithm and 23 futures contracts. Below, we remove the stop-loss.
Case 2: Strategy does not use a stop-loss
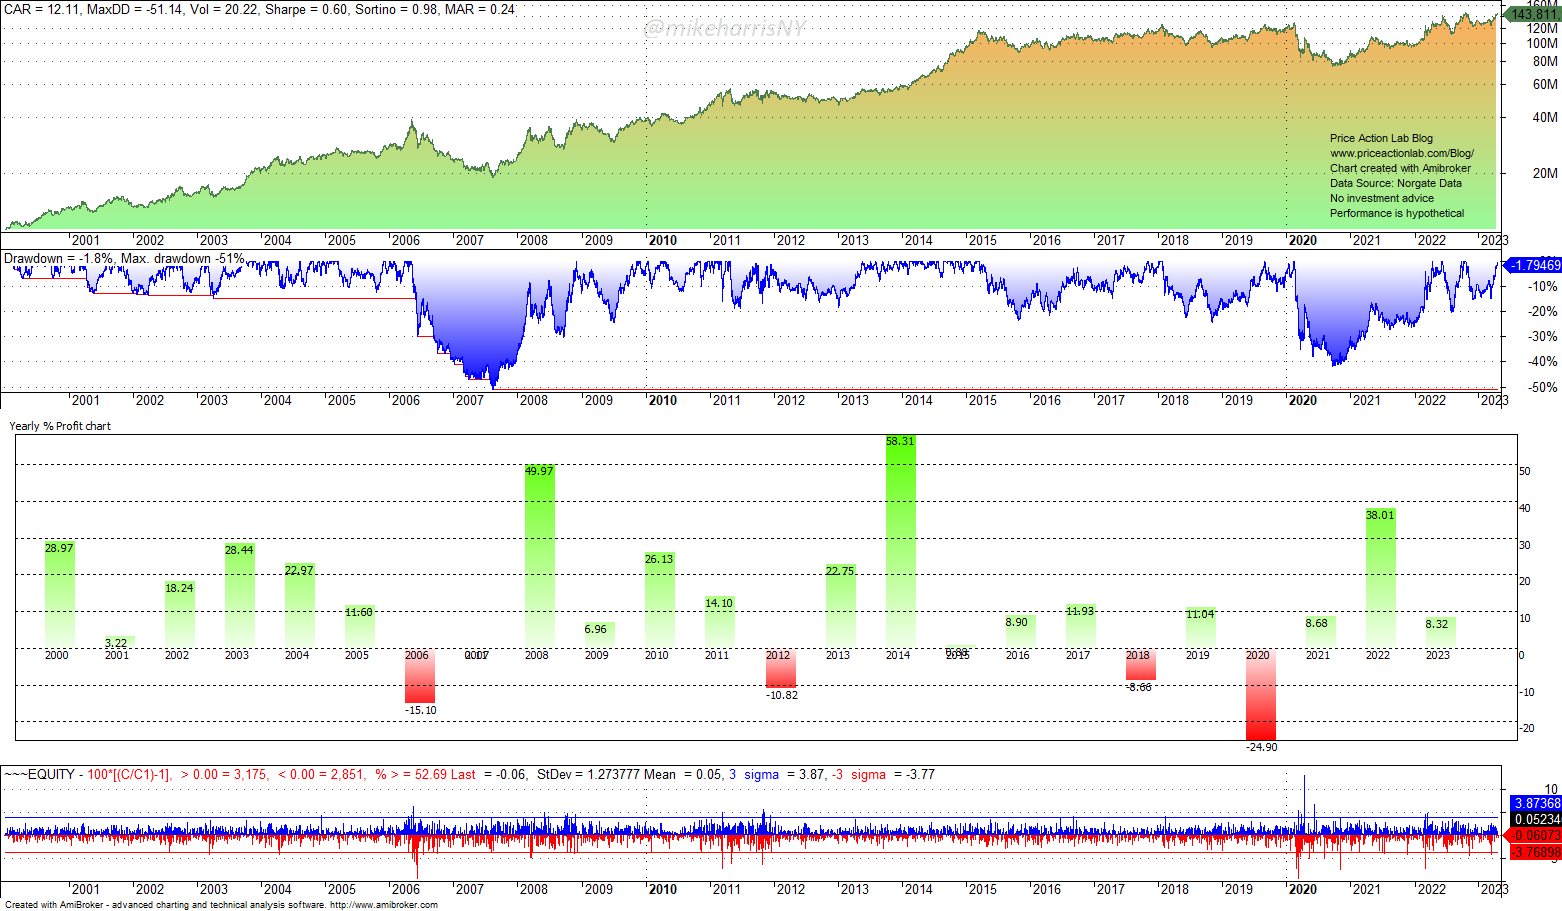
There are some significant differences between classic and basic trend-following. Below is a table that lists key metrics.
| Classic (with stop-loss) | Basic (no stop-loss) | |
| Annualized return | 13.1% | 12.1% |
| Maximum drawdown | -30.4% | -51.1% |
| Volatility | 18.3% | 20.2% |
| Sharpe ratio | 0.71 | 0.60 |
| Number of trades | 1,039 | 569 |
| Win rate | 20.0% | 39.5% |
With basic trend-following, the annualized return falls and the maximum drawdown increases, but the number of trades (and associated costs) is about half, and more importantly, the win rate is about double. These are significant trade-offs. For example, for a trader who cannot live with a 20% win rate but can withstand a 50% drawdown, basic trend-following is a better choice in this case.
Example 2. Breakouts with Russell 2000 stocks. Backtest period: 01/04/1993 – 04/26/2023. Delisted securities were handled by Norgate Data. Trades the top 100 stocks based on momentum ranking.
Case 1: Strategy includes a stop-loss
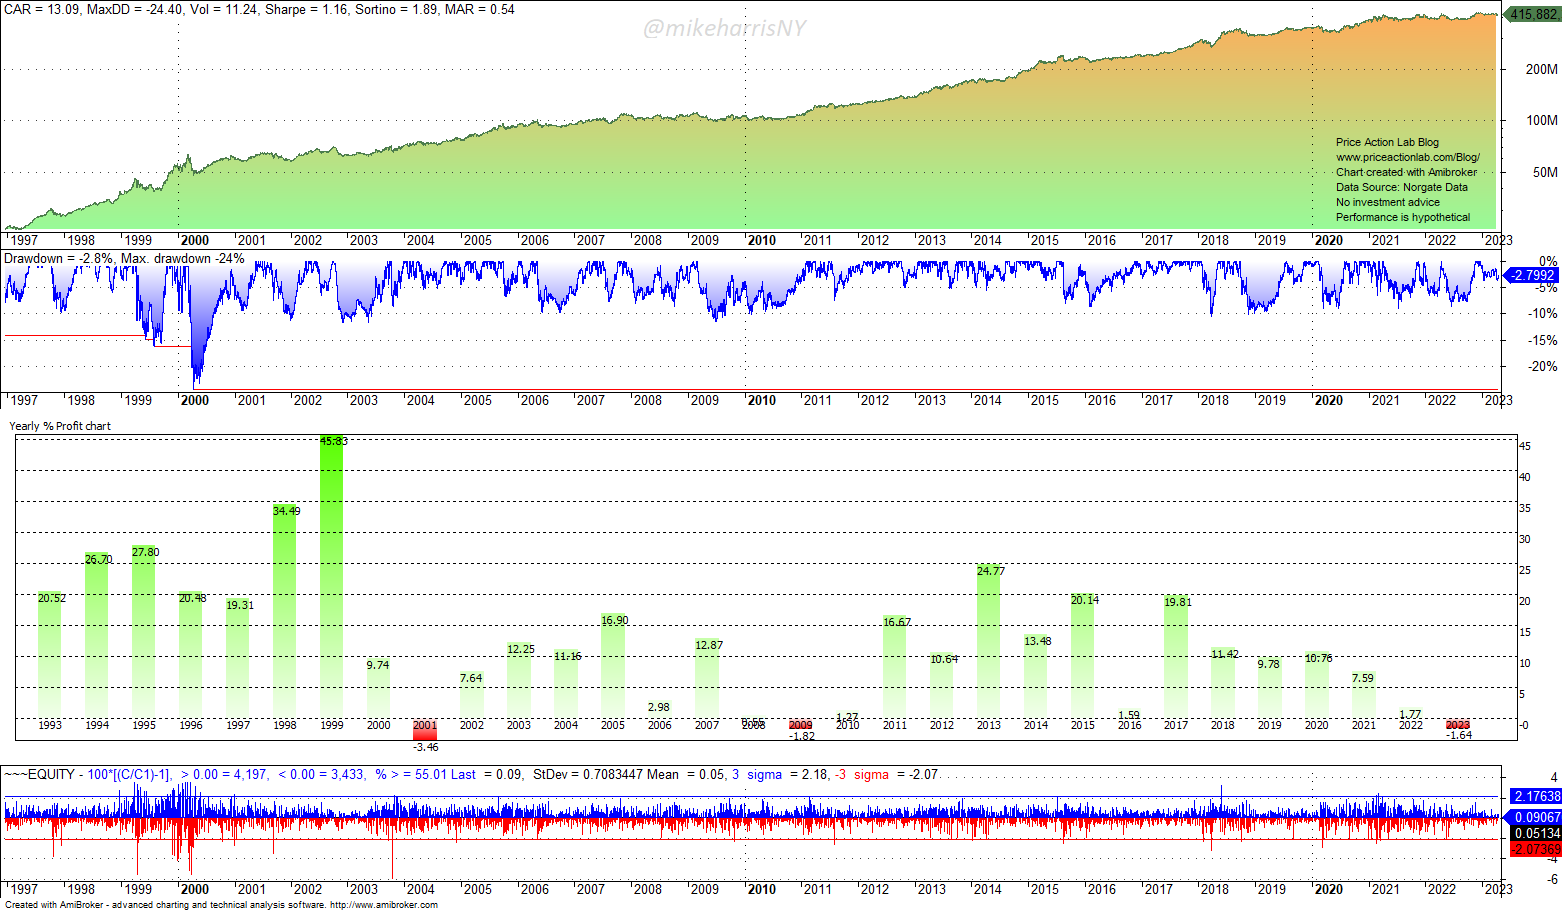
Classic trend-following with stops has worked well in small caps, but the win rate is extremely low, on the order of 2% only. A strategy with such a low win rate is hard to execute. However, we use it as an example of how stop-loss can affect trade-offs.
Case 2: Strategy does not use a stop-loss
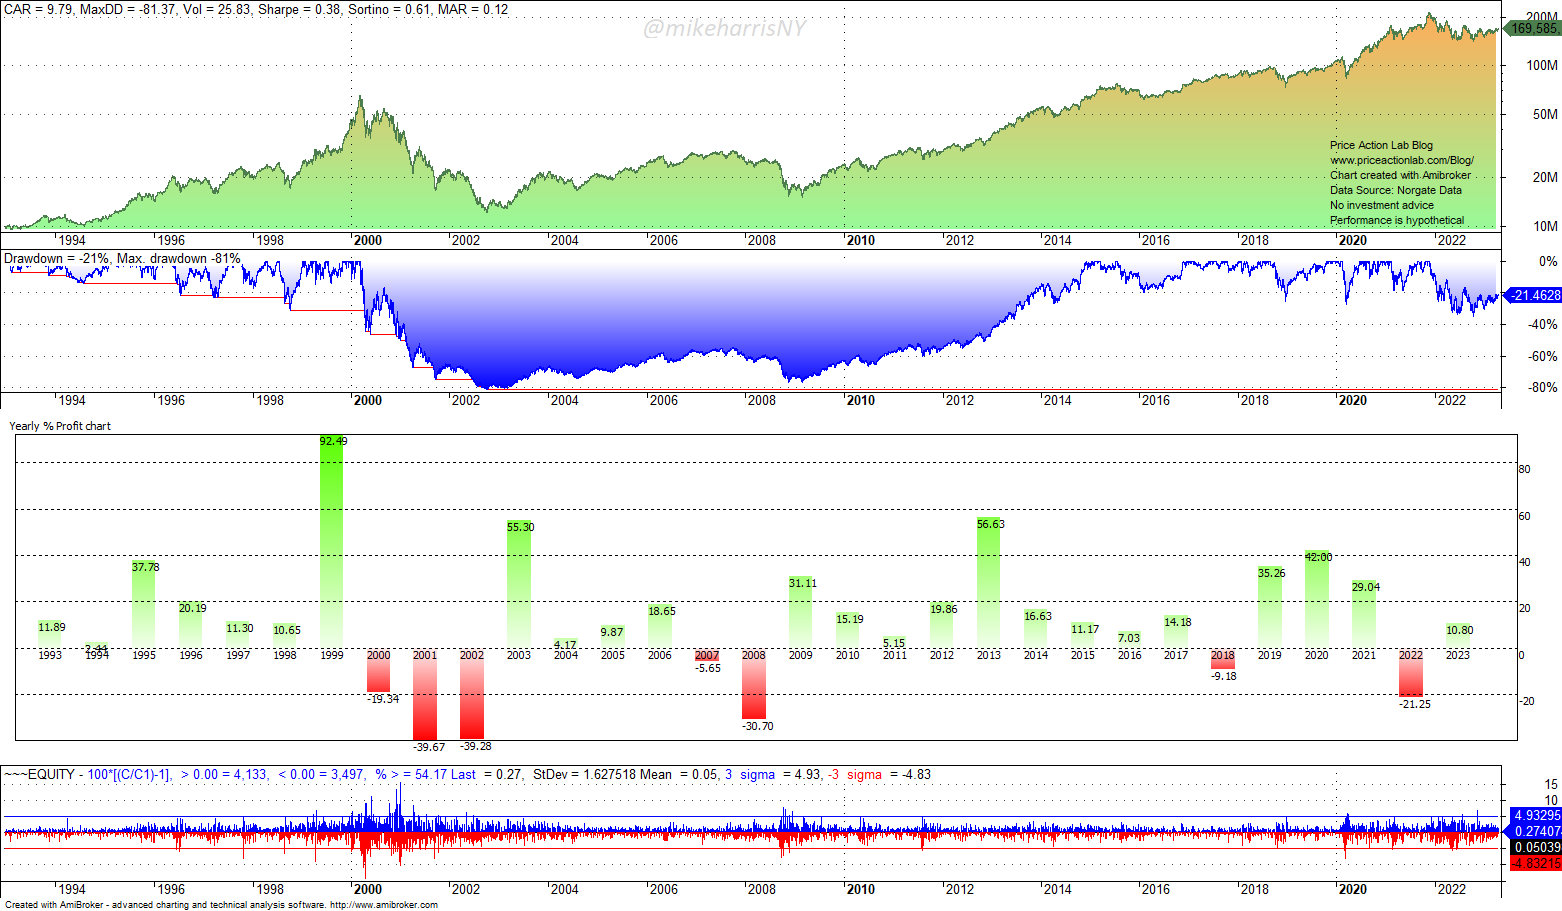
Not using a stop-loss increases the win rate dramatically from less than 2% to nearly 43% and reduces the number of trades by an order of magnitude, but at the cost of an extremely large drawdown during the dot-com bear market.
Below is a table that lists key metrics.
| Classic (with stop-loss) | Basic (no stop-loss) | |
| Annualized return | 13.1% | 9.8% |
| Maximum drawdown | -24.4% | -81.4% |
| Volatility | 11.2% | 25.8% |
| Sharpe ratio | 1.16 | 0.38 |
| Number of trades | 91,144 | 1,984 |
| Win rate | 1.8% | 42.9% |
After 2003, trend-following small caps with or without stop-loss has worked well, and it is one reason most published backtests usually start after the dot-com bear market. However, even before that, classic trend-following with stops has worked well with small caps, although the strategy has an extremely low win rate with many small losers and a few outliers with large profits. Nevertheless, the same trade-off as in Example 1 is present, i.e., basic trend-following works and has a higher win rate but a larger drawdown.
Premium Content
Online Books
Premium Articles
Systematic Market Signals
Trading Strategies
By subscribing you have immediate access to hundreds of articles. Premium Articles subscribers have immediate access to more than two hundred articles and All in One subscribers have access to all premium articles, books, premium insights, and market signals content.
Free Book
Subscribe for free notifications of new posts and updates from the Price Action Lab Blog and receive a PDF of the book “Profitability and Systematic Trading” (Wiley, 2008) free of charge.
Disclaimer: No part of the analysis in this blog constitutes a trade recommendation. The past performance of any trading system or methodology is not necessarily indicative of future results. Read the full disclaimer here.
Charting and backtesting program: Amibroker. Data provider: Norgate Data


