


This article provides an update on the performance of the PSI5 strategy applied in divergent (trend-following) mode to 23 futures contracts in the daily and weekly timeframes.
The PSI5 algo is not data-mined but based on a formula that models price action from a text in probability theory. The algo can be used in mean-reversion (convergent) or trend-following (divergent) mode. The examples below are for the performance of the algo in a divergent mode with daily and weekly futures data. For recent convergent mode results click here.
Strategy*
Initial capital: $10 million
Timeframe: Daily or weekly data
Markets: 23 futures contracts (Norgate Data)
Strategy: PSI5 algo, long-short
Entries: Next open
Exits: Next open or stop intraday.
Risk management: Stop-loss based on ATR
Position sizing: Based on 0.5% risk per position
Backtest period: 01/03/2000 – 06/09/2023
Commission and slippage: None
*The full details of the strategy are in the document provided to customers who purchase the PSI5 algo.
Daily data
Equity curve, Yearly returns, Daily Returns, and Drawdown profile
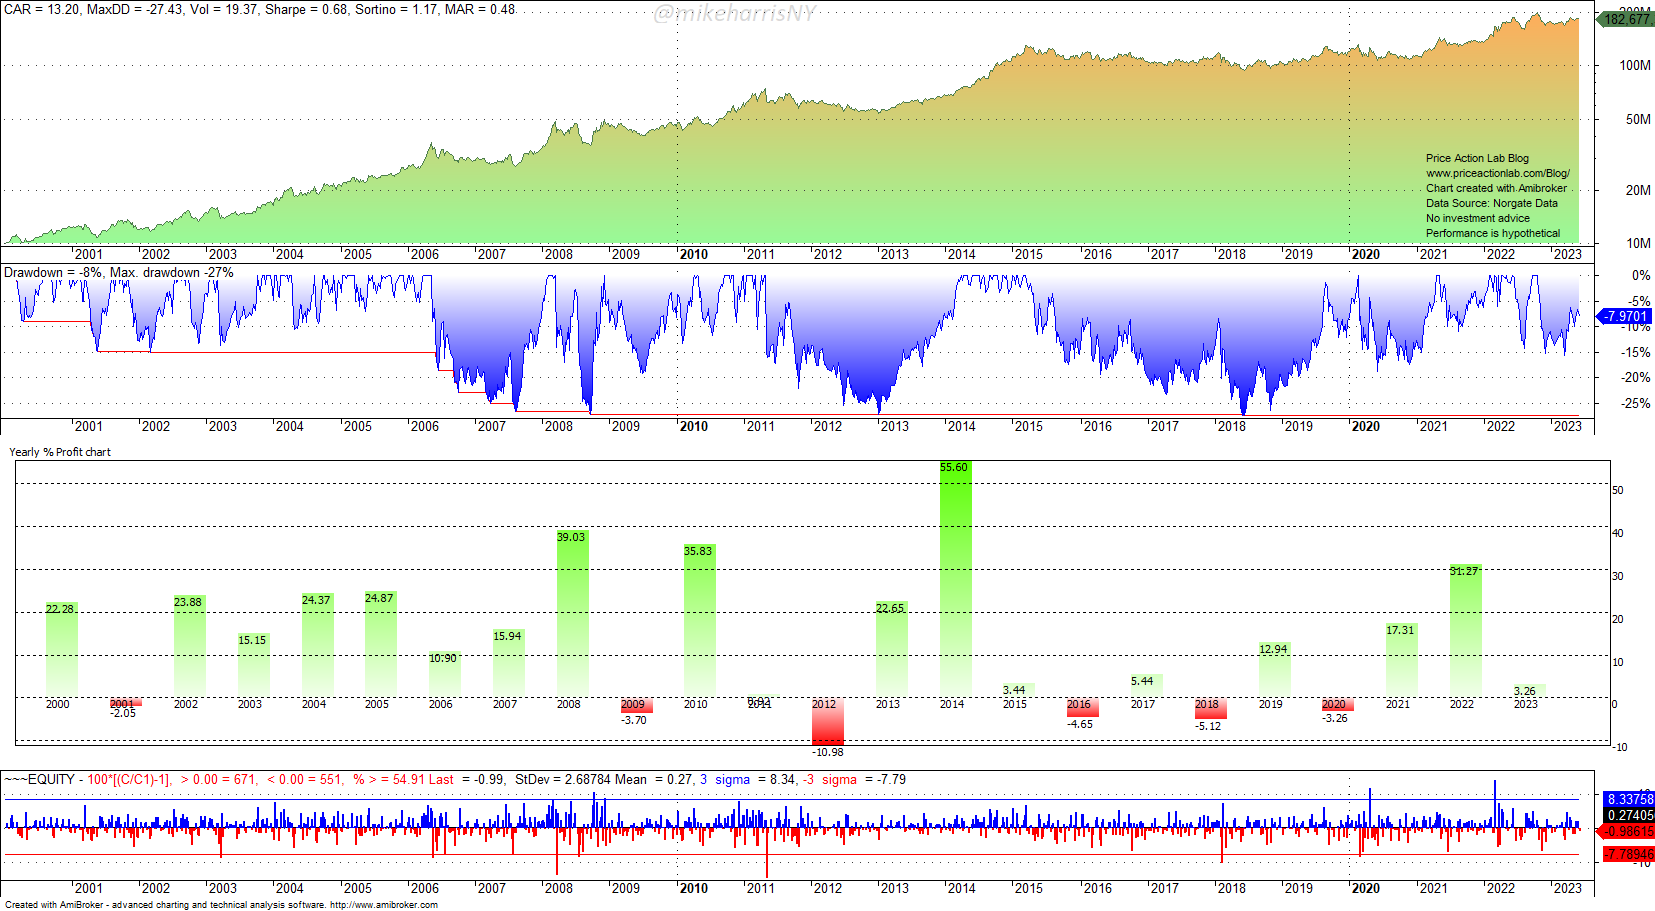
Year-to-date the strategy is up 3.3% after gaining 31.3% last year.
Weekly data
Equity curve, Yearly returns, Daily Returns, and Drawdown profile
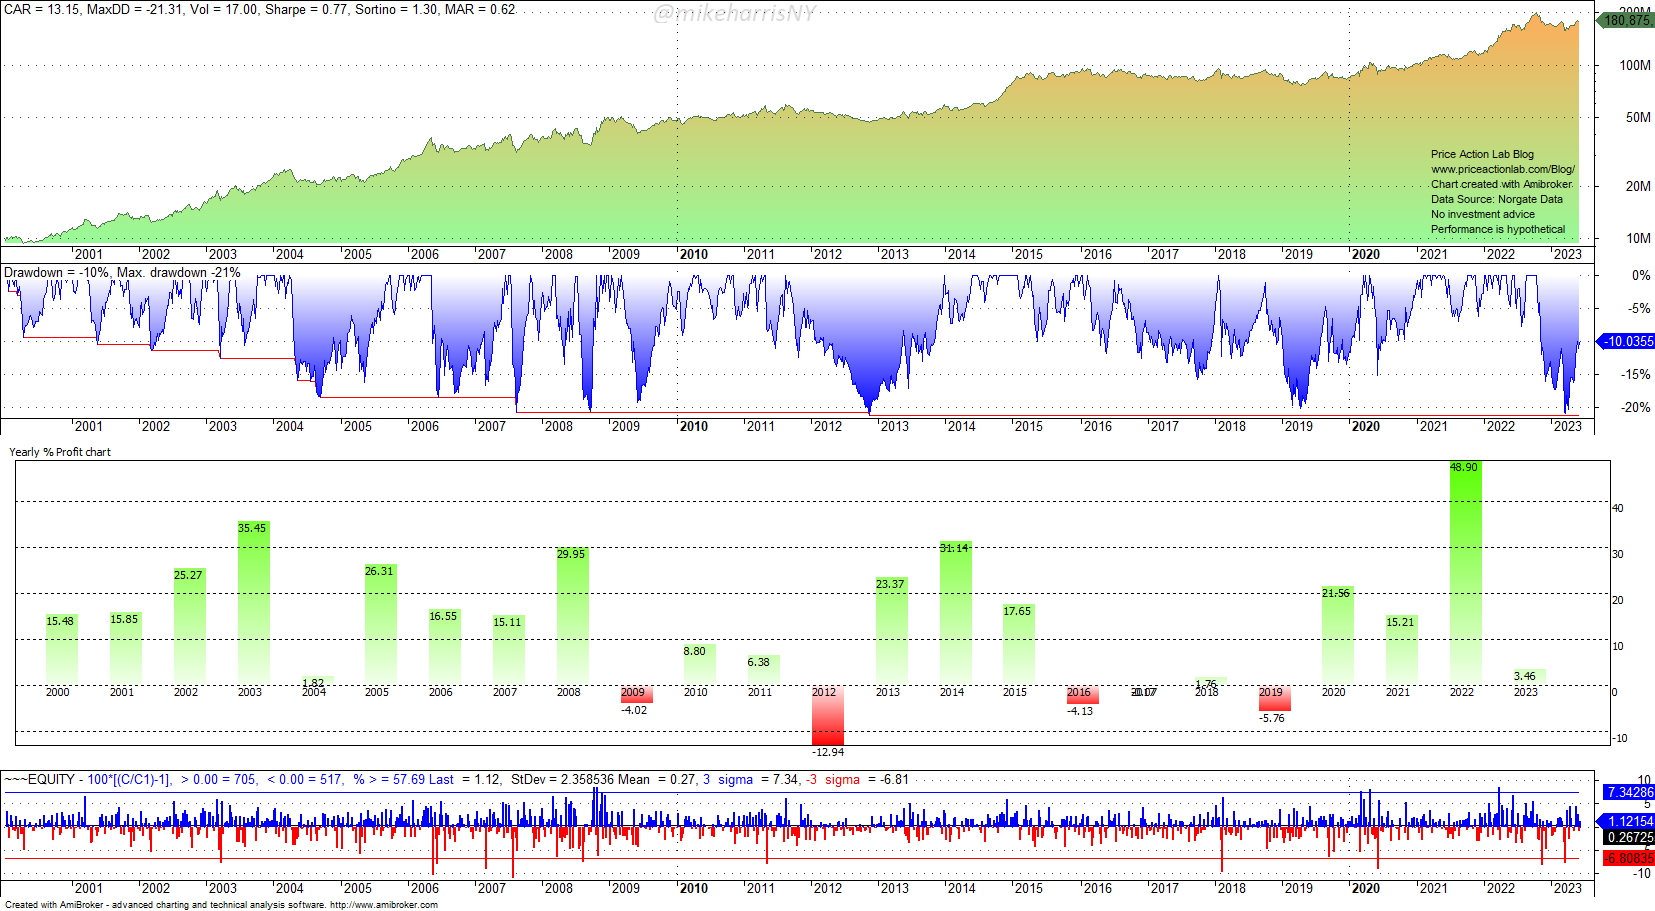
Year-to-date the strategy is up 3.9% after gaining 48.9% last year.
Performance comparison table
| DAILY DATA | WEEKLY DATA | |
| CAGR | 13.6% | 13.2% |
| MAX. DD | -27.4% | -21.4% |
| VOLATILITY | 19.4% | 17.0% |
| SHARPE | 0.66 | 0.77 |
| WIN % | 20.0% | 35.4% |
| PAYOFF | 6.5 | 3.7 |
| ALL TRADES | 1042 | 645 |
| LONG TRADES | 542 | 323 |
| SHORT TRADES | 500 | 322 |
| AVERAGE TRADE % | 17.8% | 52.1% |
| EXPOSURE | 66% | 60% |
| AVERAGE BARS HELD | 197 (daily bars) | 46 (weekly bars) |
Comments
The choice of timeframe is not important in long-term trend-following, although it may affect the level of “trading comfort”. Daily data yields a lower win rate and more trades, but a higher payoff ratio. On the other hand, weekly data yield a much higher win rate and fewer trades, but a lower payoff ratio. The discipline of execution is more important in trend-following than the choice of timeframe. In the long term, the performances of the two strategies are statistically indistinguishable. Following the strategy is a necessary condition for realizing long-term expectations.
Click here for a list of strategies.
Charting and backtesting program: Amibroker. Data provider: Norgate Data
If you found this article interesting, you may follow this blog via RSS or Email, or on Twitter.
Disclaimer: No part of the analysis in this blog constitutes a trade recommendation. The past performance of any trading system or methodology is not necessarily indicative of future results. Read the full disclaimer here.
Hypothetical or simulated performance results have certain inherent limitations. Unlike an actual performance record, simulated performance results do not represent actual trading. Also, since the trades have not actually been executed, the results may have under- or over-compensated for the impact, if any, of certain market factors, such as lack of liquidity. Hypothetical trading results are also subject to the fact that they are designed with the benefit of hindsight. No representation is being made that any account will or is likely to achieve profits or losses similar to those shown.


