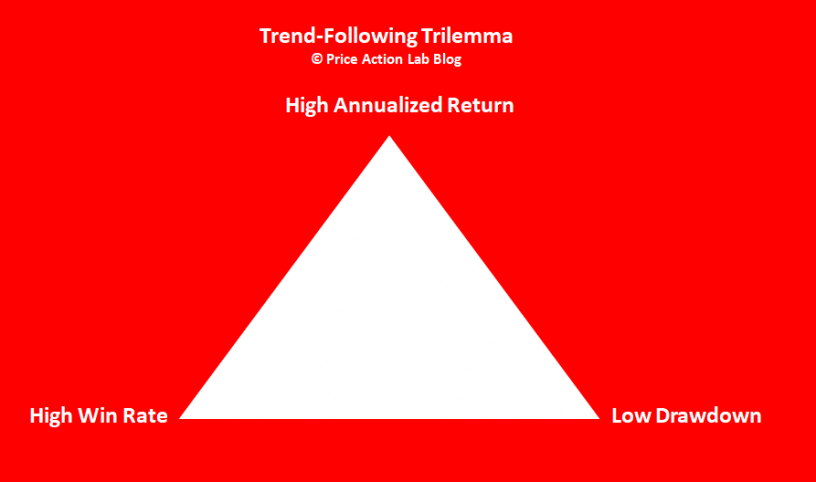


I extend the impossible trilemma concept from economics to trend-following: It is impossible to have a high annualized return, a high win rate, and a low drawdown at the same time. I call this trend-following Trilemma (© Price Action Lab Blog)
The impossible trilemma (also known as the impossible trinity) is an important concept from economics that states that it is impossible for an economy to have independent monetary policy, free capital movement, and a fixed foreign exchange all at the same time.
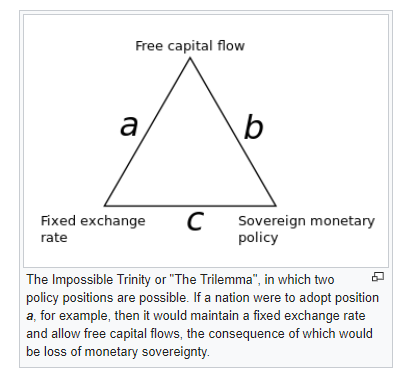
Source: Wikipedia
For example, in the case of the US economy, there is independent monetary policy and free capital movement, but a floating exchange rate. On the other hand, China has a fixed exchange rate (for all practical purposes), an independent monetary policy, and no free capital movement.
After many years of analyzing trend-following, I have concluded that there is also another impossible trilemma: it is impossible to have a high annualized return, a high win rate, and a low drawdown at the same time. I call this the trend-following Trilemma (© Price Action Lab Blog).
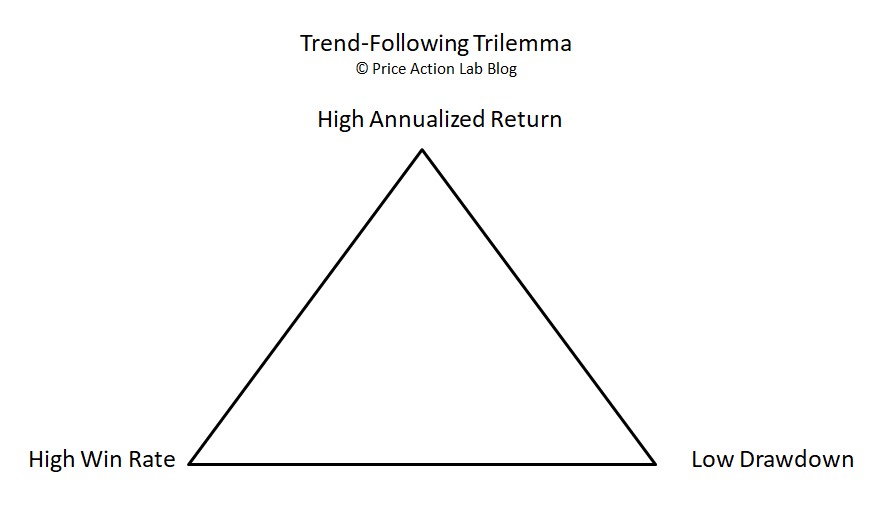
According to the trend-following trilemma, the following are possible:
- High annualized return, high win rate, but higher drawdown
- High annualized return, low drawdown, but lower win rate
- High win rate, low drawdown, but lower annualized return
The trilemma arises from the trade-offs imposed when varying the trend signal lookback period, the trade risk stop-loss, and the position risk as a percentage of available closed equity.
For example, when the lookback period is increased, the annualized return is increased due to larger gains from capturing longer trends, while the maximum drawdown is kept lower, but at the expense of a lower win rate. If the lookback period is shortened, then there are more trades with a higher win rate, and the drawdown may not increase much, but the annualized return decreases. The reason for the increase in the win rate for shorter lookback periods is a lower payoff ratio.
There is a formula that relates the win rate w to the payoff ratio:
w = PF/(PF+R) (1)
where w is the win rate, PF is the profit factor, and R is the average win-to-average loss ratio (payoff ratio).
As the payoff ratio decreases for a given profit factor, the win rate increases and the performance of a trend-following strategy approaches that of a mean-reversion one. The reverse occurs when the payoff ratio increases. Equation (1) is exact and reflects the trade-offs present in all trading strategies. I have called it The Profitability Rule in my books and articles.
Longer lookback periods offer a higher payoff ratio because they capture longer trends but at the expense of a lower win rate for achieving the same profit factor.
The trade-off related to drawdown becomes clearer when one realizes that drawdown depth is inversely proportional to the Sharpe ratio. This is also a reason the Sharpe ratio is important and that more conservative traders target a higher value.
Drawdown depth ∼ 1/Sharpe (2)
Equation (2) implies that keeping volatility low results in a reduction in drawdown depth. A lower drawdown boosts the annualized return due to a lower volatility drag, and this justifies Choice 2 of the trilemma. In Choice 1, the drawdown increases due to the choice of a high win rate that causes higher volatility and a reduction in the Sharpe ratio. In Choice 3, the higher win rate in conjunction with a low drawdown offers a more conservative choice that results in lower annualized returns.
Choice 1 of the trilemma above is popular: High annualized return, a high win rate, but a high drawdown. This choice increases the risk of an uncle point.
Choice 2 of the trilemma is avoided because of the psychological burden of a low win rate and the high probability of losing discipline.
Choice 3 of the trilemma is what most trend-followers try to avoid but end up facing anyway: a low annualized return.
Examples
I used a classical “one-entry, one-exit, and a stop-loss” trend-following strategy based on breakouts in the daily timeframe to illustrate the limitations imposed by the trilemma. The strategy was applied to 23 futures contracts from March 1, 2000, to July 26, 2023.
Case 1: 50-day breakouts, 0.5% risk per trade.

The annualized return is 9.4%, the maximum drawdown is 39%, and the win rate is 26.5%. This result fits choice 1 of the trilemma.
Case 2. 150-day breakouts, 0.5% risk per trade
Here, I increased the breakout lookback period from 50 to 150 days.
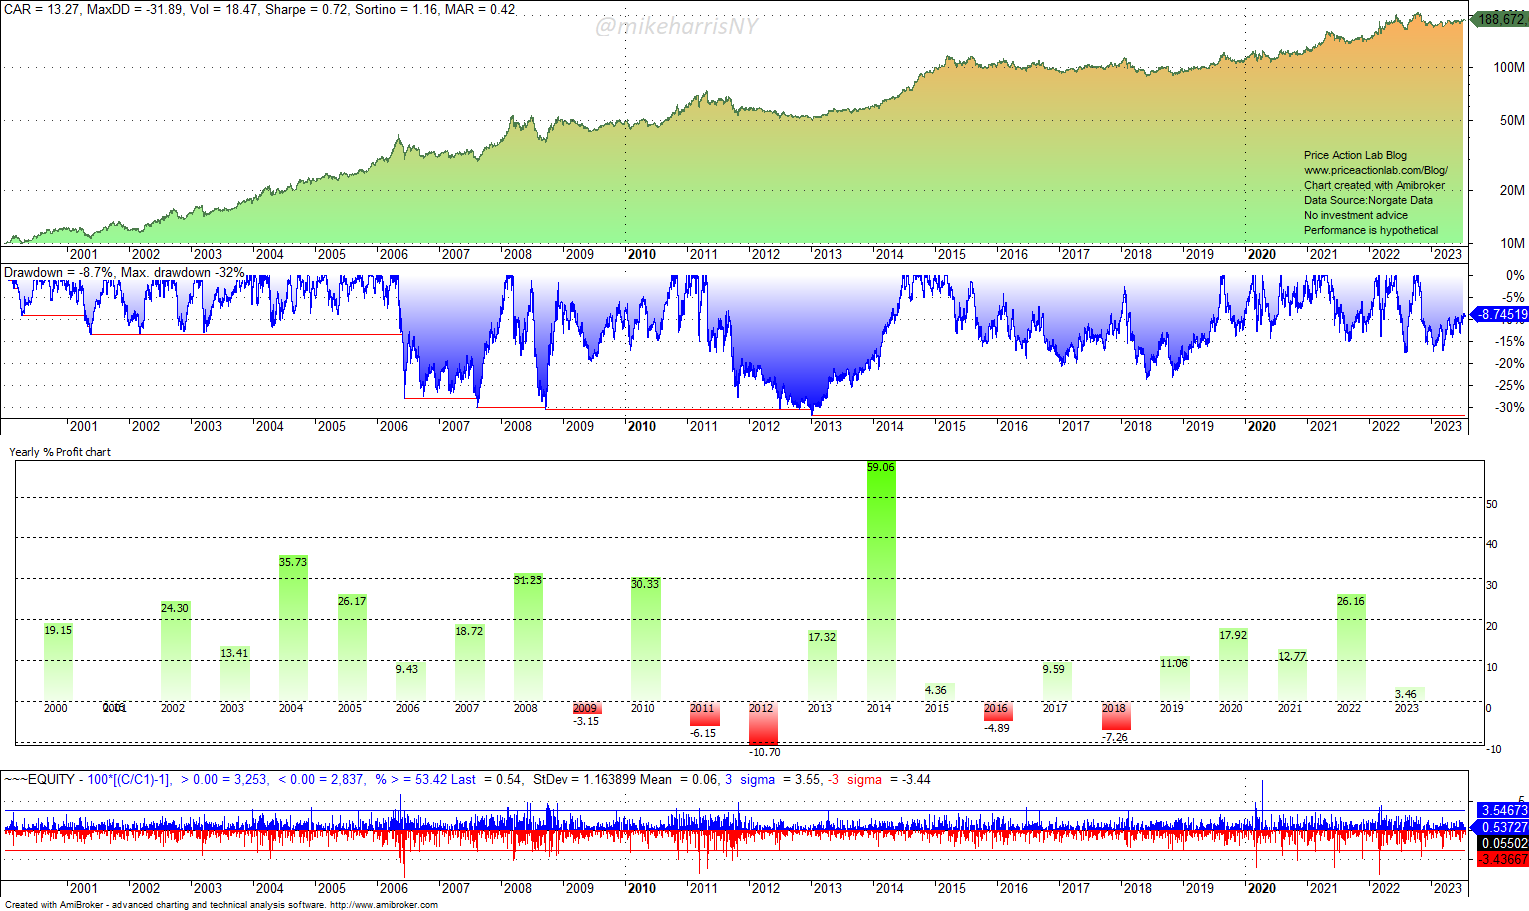
The annualized return increased to 13.3%, the maximum drawdown decreased to 32%, and the win rate dropped to 18.2%. This fits choice 2 of the trilemma.
Case 3: 50-day breakouts, 0.2% risk per trade
With 50-day breakouts and a smaller risk per trade, the drawdown decreases significantly compared to Case 1 above, but the annualized return is also significantly lower.

This fits choice 3 of the trilemma: high win rate, low drawdown, but low annualized return.
Comments
I attend podcasts and X (Twitter) spaces where some traders brag about the high win rates above 35% of their trend-following strategies. I take those with a grain of salt, especially when drawdown levels are not mentioned. Some over-fitted strategies with many variables, filters, and a special selection of traded markets may show high win rates, high annualized returns, and low drawdowns in backtests, but in actual trading, the performance usually deteriorates.
Some traders are skilled and, with discretion, can increase the win rate, lower the drawdown, and maintain high annualized returns. Every stochastic process has outliers. However, these are exceptions due to survivorship bias. In addition, optimization does wonders with backtesting, but strategies that try to break fundamental trade-offs do not last long.
Free Book
Subscribe for free notifications of new posts and updates from the Price Action Lab Blog and receive a PDF of the book “Profitability and Systematic Trading” (Wiley, 2008) free of charge.
Disclaimer: No part of the analysis in this blog constitutes a trade recommendation. The past performance of any trading system or methodology is not necessarily indicative of future results. Read the full disclaimer here.
Charting and backtesting program: Amibroker. Data provider: Norgate Data
If you found this article interesting, you may follow this blog via RSS, Email, or Twitter.


