


Equities rise longer-term but due to low Sharpe ratio investors are exposed to high risks of large and prolonged drawdown periods.
The upward drift in the US stock market may continue even after another bear market, as long as innovation remains strong and new companies join benchmark indexes that are tracked by investors.
However, investors in equities are exposed to risks of large price swings and prolonged drawdown periods. This has been the case in the last 80 years with an average drawdown of about 10% in S&P 500, as shown below.
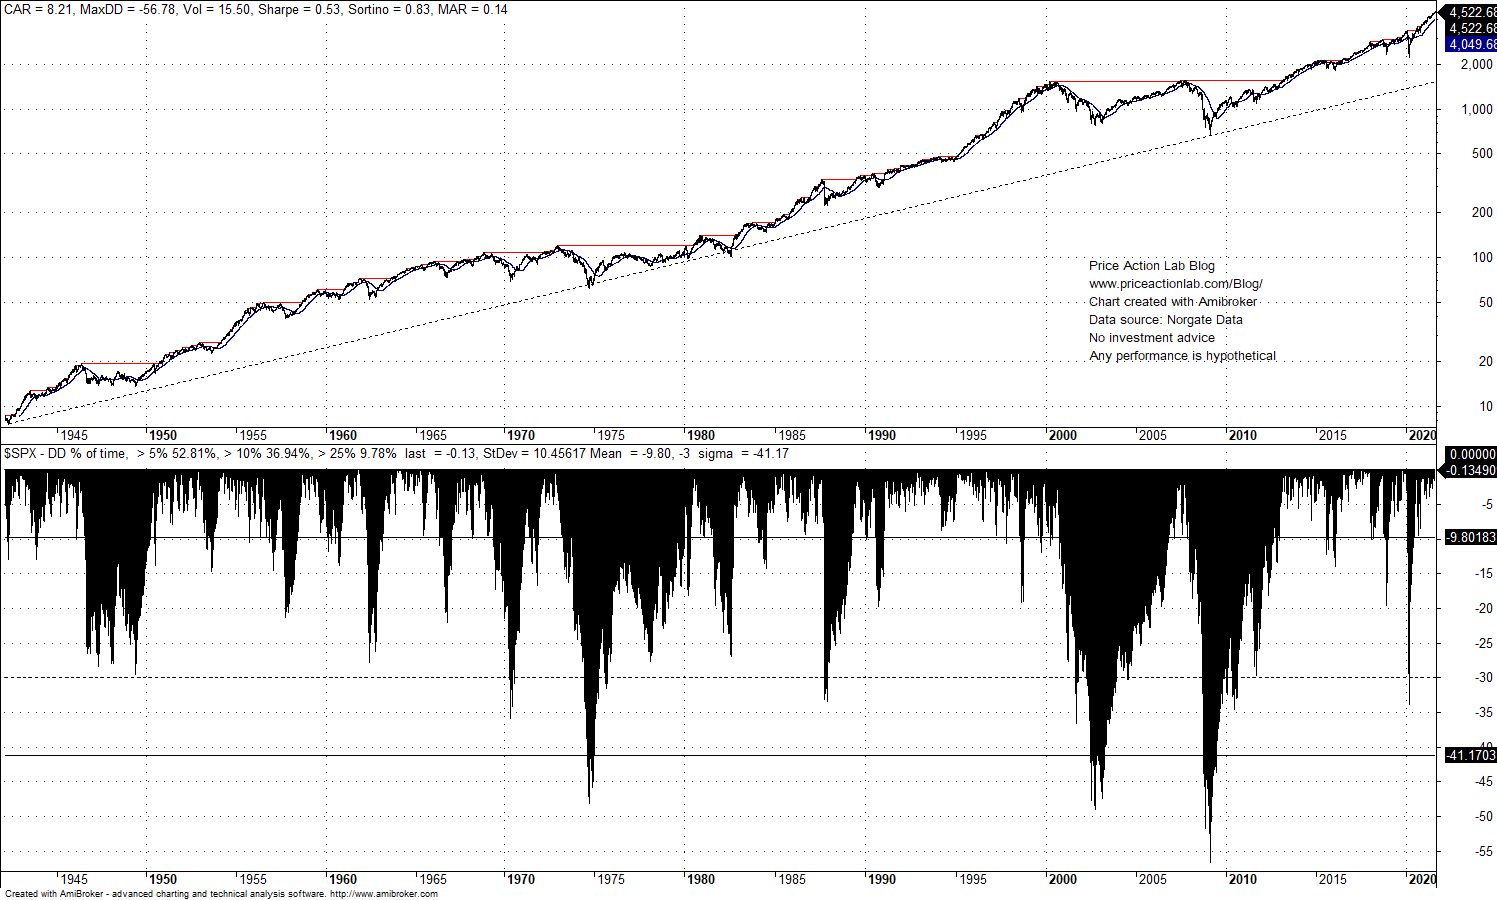
Specifically, 53% of the time, the S&P 500 index has been in a drawdown of more than 5%, 37% of the time in a drawdown of more than 10% and about 10% of the time in a drawdown of more than 25%. This is not an easy ride for passive investors.
Furthermore, there have been three occasions when the drawdown exceeded three standard deviations of the available sample at -41.2%, one in the 70s and twice in the 2000s. During eight occasions the drawdown came near or exceeded 30%.
The above are a result of the low Sharpe ratio of the S&P 500 at 0.53. Duration and drawdown depth are related to the Sharpe ratio as follows*:
- Drawdown duration is proportional to 1/(Sharpe)^2
- Drawdown depth is proportional to 1/Sharpe
*Based on random walk with drift. Math details are left out and beyond the scope of this brief article.
For example, when Sharpe is 0.5, the expected drawdown duration is (1/0.5)^2 = 4 years. The depth is proportional to 2 × Volatility or 2 × 15.5% = 31%.
A Monte Carlo simulation of buy and hold equity changes reveals that the probability of drawdown larger than 53% is about 25%.

Although Monte Carlo simulations are based on several assumptions and equating percentiles to probability is made in a very loose sense, the results nevertheless reveal how risky is buying and holding equities although the longer-term chart shows a strong longer-term uptrend. The problem is that this is a low Sharpe uptrend at 15.5% volatility.
Stocks will probably continue on an uptrend even after another bear market due to structural drift. However, some investors may not be able to stay in the market after a large loss and depending on when they invested. Large drawdown levels may cause uncle point and reluctance to stay invested. This was a serious issue during the dot com crash for people that invested in the last years of the 90s uptrend and also for those that invested before the Great Financial Crisis.
Although central banks may have shortened drawdown durations after 2008 by facilitating faster recoveries in the form of V-bottoms, the low Sharpe ratio remains and reflects the high risks of investing in equities without proper diversification or tail risk hedging.
Disclaimer: No part of the analysis in this blog constitutes a trade recommendation. Read the full disclaimer here.
Charting and backtesting program: Amibroker. Data provider: Norgate Data
If you found this article interesting, you may follow this blog via RSS or Email, or in Twitter.
Price Action Lab premium Content: By subscribing you have immediate access to hundreds of articles. Premium Insights subscribers have immediate access to more than a hundred articles, Premium Articles and Market Signals subscribers have immediate access to hundreds of articles that include the trader education section and All in One subscribers have access to all past premium content. Click here for more details.

Price Action Lab Blog Premium Content


