


Despite its purported simplicity, trend-following has a huge optimization space due to a large number of parameters. This is the primary reason for the large dispersion in performance across trend-following commodity trading advisors (CTAs).
In an article on October 9, 2023, I wrote about trend-following risks and discussed the performance of the top CTA program in the last three years. I made a brief reference to the huge optimization space and my efforts to analyze CTA performance in that context.
The marketing departments present trend-following as a simple idea: “We follow price moves; we do not predict; we let profits run and cut losses short.” But the reality is much more complex.
The marketing pitch is designed to appease investors because trend-followers make market forecasts just like everyone else. The use of the “term” prediction aims to put on everyone else the stigma of a leaf reader and distance trend-following from their practice. However, the truth is that all traders, in all timeframes, when they place a trade explicitly or implicitly, make forecasts; otherwise, they should stay flat. A trader who does not realize this probably does not understand the subject of forecasting and statistics but instead is immersed in some narrative.
Trend-following strategies, even some of the simplest ones, have a large number of parameters that make them sensitive to overfitting in backtests and in specific market regimes in actual trading. The number of parameters varies depending on the sophistication of the strategy and the markets traded. I provide below a non-exhaustive list of parameters used in trend-following. Note that not all parameters need to be present in a strategy.
| Entry and Exit Signal Parameters
The lookback period for entry signals (moving averages, breakouts, etc.) |
| Risk Parameters
Percent of equity at risk |
| Stop-loss Parameters
ATR lookback period |
| Trailing Stops
ATR lookback |
| Position Size
Based on risk parameters and stop-loss |
| Dynamic Adjustments
Entry/exit lookback periods |
| Market Filters
Selection of markets to trade |
| Targeting Functions
Volatility target |
As you can see, even a small subset of the above possibilities maps to a huge optimization space. Depending on the nature of the model, variations in some parameters may not have a material impact. However, even if we consider only the entry/exit, risk parameters, and position size variations without any dynamic adjustments or filters, which is what is referred to as “classical trend-following”, the result is still a vast optimization space.
Examples
I will only include two examples of the simplest possible trend-following strategy based on price breakouts that trade 23 liquid futures contracts. This is a “classical trend-following, with entry, exit, and stop-loss. The parameters remain the same in the two examples; only the breakout lookback period changes. The backtest period is from January 3, 2000, to October 11, 2023.
The first example is a breakout period of 150 days.
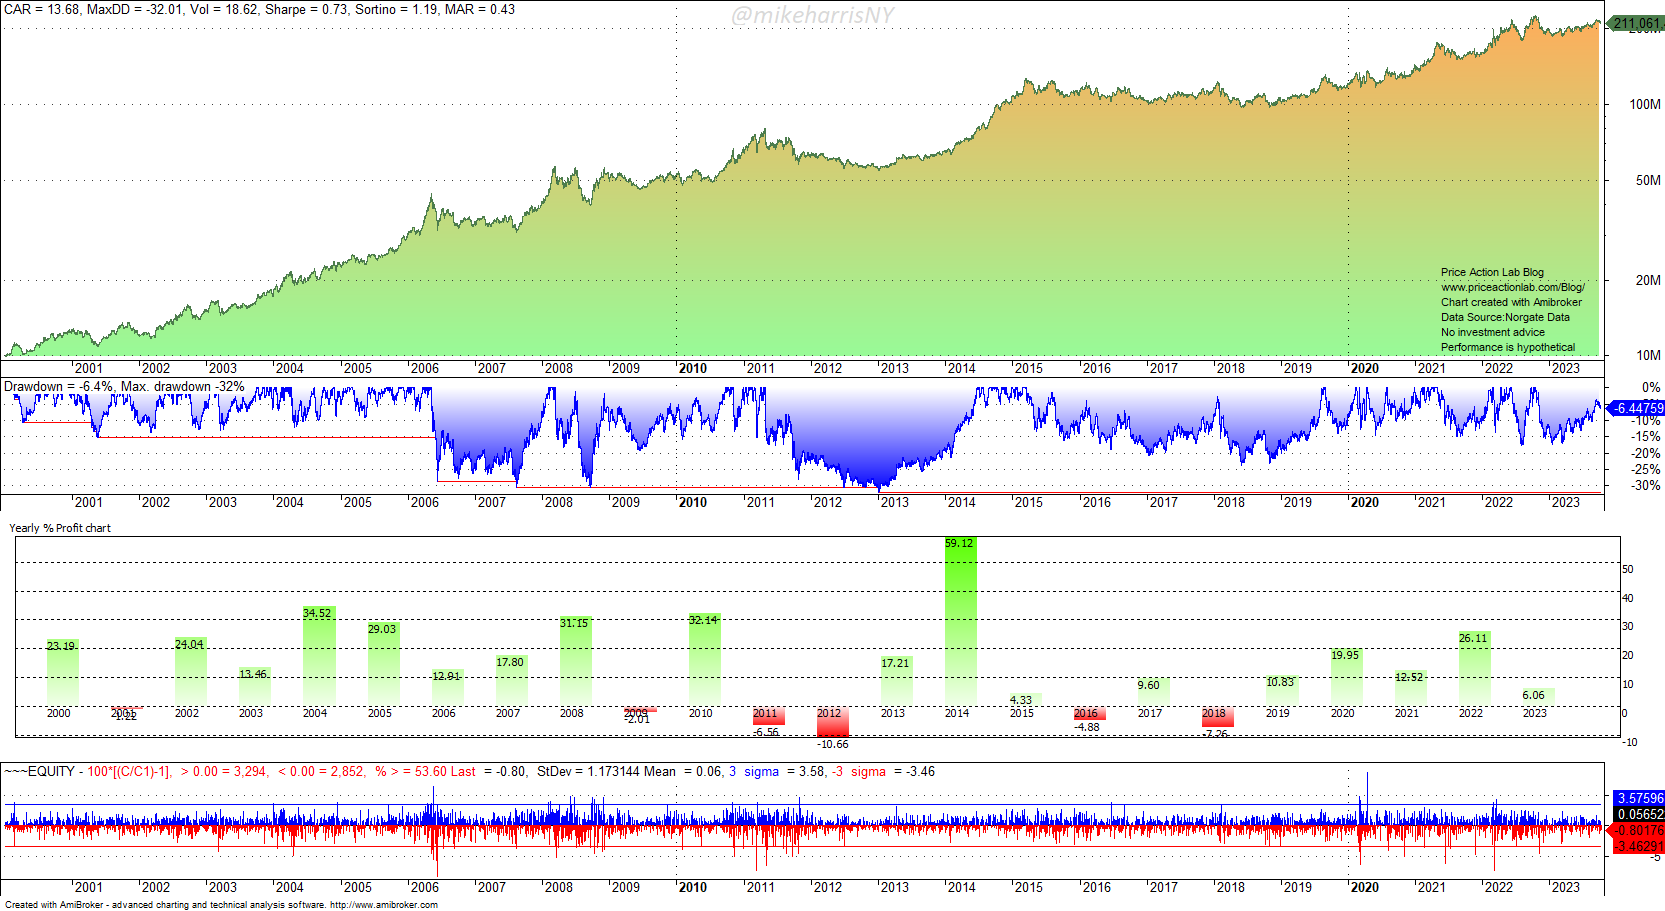
The annualized return is 13.7%, the maximum drawdown is 32%, and the Sharpe ratio is 0.73.
The second example is a breakout period of 50 days.
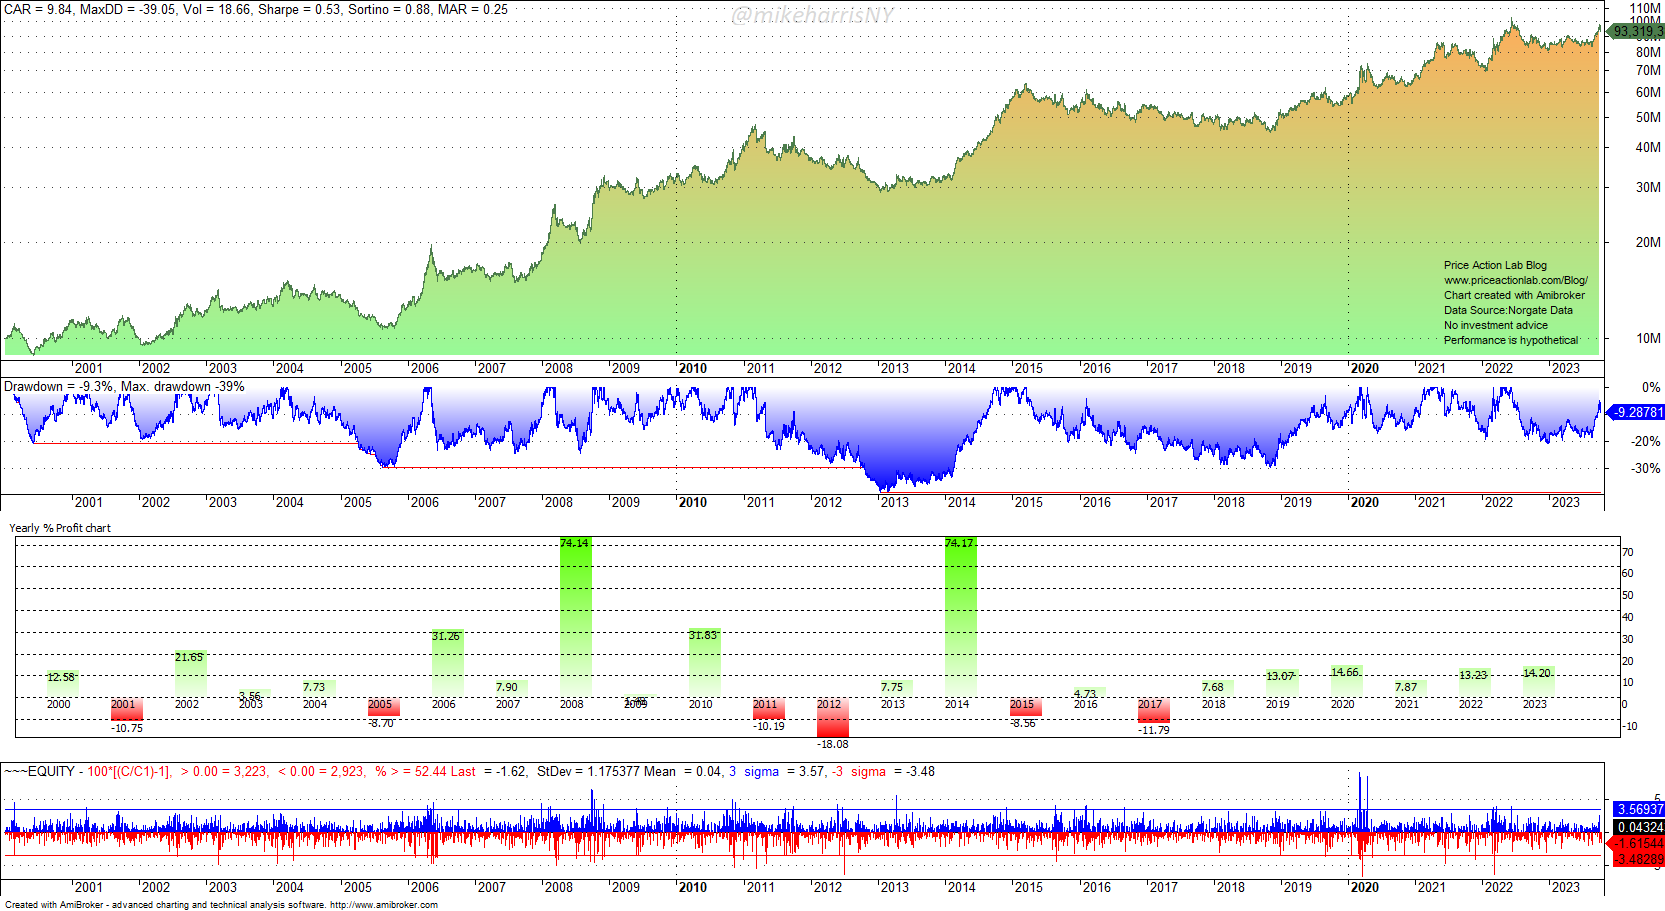
The annualized return dropped to 9.8%, the maximum drawdown increased to nearly 40%, and the Sharpe ratio fell to 0.53.
Note that in 2008, the second example generated a return of 74% versus 32% for the first. Now imagine the financial media reaction to these high returns of a CTA using the strategy in the second example.
Despite lower returns in 2008 and 2014, the first example yielded a much higher annualized return and Sharpe ratio. However, high annual returns get the attention of financial media, although they are an artifact of randomness, non-stationarity, and lucky choice of parameters.
I believe the reader gets the idea: trend-following is more of a conundrum than a simple approach to markets. People tend to focus on high performance during some years instead of consistency. Those who underperform are not always incapable of developing or using a good strategy; it just happened that they used the wrong cross-section of the huge optimization space during some market regimes. Eventually, it may happen to all, but luck plays a role in this game. At the same time, those who win big might have been lucky to use the right parameters.
Some CTAs have produced excellent risk-adjusted returns over the years, and at the same time, there have been others who were forced to exit the market. Given a distribution of a large number of managers, there will always be some at the right tail and some at the left; this is an outcome of the huge optimization space due to a large number of parameters. This huge optimization space also makes it hard to differentiate skill from luck.
Free Book
Get a free PDF of the book “Profitability and Systematic Trading” (Wiley, 2008) by subscribing to the Price Action Lab blog’s free email notifications of new posts and updates.
Disclaimer: No part of the analysis in this blog constitutes a trade recommendation. The past performance of any trading system or methodology is not necessarily indicative of future results. Read the full disclaimer here.


