


Although it is presented as a simple trading style that “lets profits run and cuts losses short”, in reality, trend-following has a huge optimization space. The result is high dispersion in the returns of various managers, periods of high performance, but also periods of extended underperformance.
Background
Trend-following is a dynamic trading style that offers the potential of absolute returns but also suffers from low-risk-adjusted returns. I have studied trend-following for many years. I started trading in the early 1990s in currency futures with a trend-following strategy my partner and I developed. The strategy was strictly systematic, and in the first year, we realized a large gain on a six-figure account in which we had invested. My partner became excited and started selling the idea to a few wealthy people he knew. They also got excited. I was not excited at all.
The problem was that after I ran some statistical simulations, I concluded that there was a high probability that our choice of parameters for the moving averages we were using was random but suitable for the current environment. The risk of a large drawdown in the future was higher than 50%. I decided I did not want to get involved, took my share of profits, taught my partner and his new assistant how to use the strategy, and started looking for a job.
After about two years, I found out that my ex-partner had raised a few million but terminated the fund after a drawdown of about 50%. I continued researching trend-following, but I had a hard time differentiating between marketing and real analysis in the space. Yes, there is huge potential, but risks are high, and luck also plays an important role.
The Top CTA
After a lost decade from 2009 to 2018 with the SG CTA index ending flat, due to random events in 2020, trends developed in markets, and trend-following has delivered large returns in the last three years.
One of the top CTA programs, if not the top in the last three years, is the Mulvaney Global Markets Fund, with a return of about 429% (data as of the end of September 2023). Below is a yearly return chart I compiled from data available on the web.
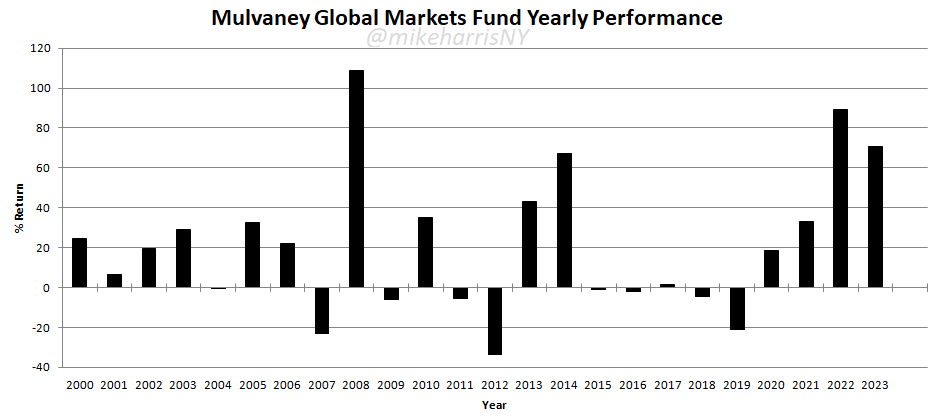
The annualized return (CAGR) is about 16%, the maximum drawdown is 45.08%, and the Sharpe ratio is 0.58.
The low Sharpe ratio is due to the high volatility of the equity. Specifically, the volatility is 33.71%.
“The Sharpe ratio is an irrelevant metric!”, some trend-following proponents will argue. No, it is not, and here is why. In a nutshell, markets are mean-reverting, and you have to penalize both extreme up and down moves when you calculate risk metrics.
Now, the performance in the above chart looks fantastic, but there have been three drawdowns in excess of 40% in the period considered. The largest drawdown was 45.08%, from August 2018 to August 2021, and lasted 36 months.
The second largest drawdown was 45.04% from April 2011 to September 2014 and lasted for 41 months.
The third largest drawdown was 41.28% from 04/2006 to 02/2008 and lasted for 22 months.
As you can see, absolute performance comes at a high risk of a large drawdown with extended periods of recovery. It is not as simple as “cut losses short and let profits run”.
I used the example of a top CTA to illustrate trend-following style risks. Other CTAs have done worse. Some did not survive the volatility. Investing with a CTA requires a serious commitment and willingness to face large drawdowns until the time comes to cash in. This requires faith in the program and the people involved. Luck also plays a role, along with the timing of the investment. The timing of investors is usually bad: they pick tops and abandon ships near the bottoms, although they should be doing the opposite.
In the next article, I will elaborate on the “huge optimization” space of trend-following and how that affects performance. I started writing this article with that in mind, but I know my readers have other things to do, and I will be back in the next two days.
I admit that I have been running a few powerful computers to see if some cross-section of the huge optimization space can replicate the performance of the Mulvaney Global Markets Fund. So far, I have been unable to find any. The top CTA in the last three years probably has a secret sauce. The performance is amazing. I will focus in the next article on where I believe the edge lies, but I will be speculating mostly.
Free Book
Get a free PDF of the book “Profitability and Systematic Trading” (Wiley, 2008) by subscribing to the Price Action Lab blog’s free email notifications of new posts and updates.
Disclaimer: No part of the analysis in this blog constitutes a trade recommendation. The past performance of any trading system or methodology is not necessarily indicative of future results. Read the full disclaimer here.


