


If it is just a recreational activity, day trading can be fun, but making money with it is hard due to the statistical properties of market returns. Longer timeframes offer higher odds of success but lower profit potential.
As the trading timeframe decreases, there are more extreme outliers in market data. I wrote an article in this blog last December about market predictions, and in it, I included charts and analysis that showed that S&P 500 annual returns are approximately normal. “Normal” means, among other things, that there are no extreme outliers in the data. I have included the relevant chart below.
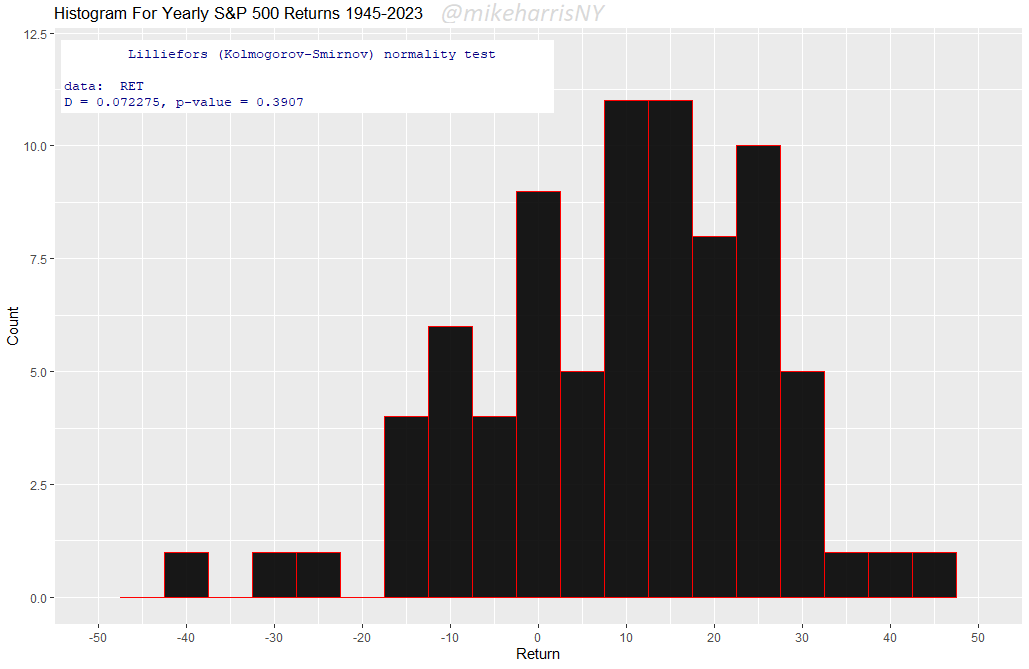
There have been both large annual losses and gains, but no outliers. Consecutive losing years can pose a problem to passive investors, but some see them as an opportunity to average down and take advantage of the long-term upward bias of the market. Passive investors who do not average down have a beta of 1 with the market and realize the long-term return and associated risks. As a result, what the market can provide caps gains. Some other investors attempt to lower the risk with market timing. The result is often a lower long-term return but better risk-adjusted returns. Traders do not like this limited potential; they want more!
Unlike a normal distribution of the annual returns, daily traders face a leptokurtic distribution with a high kurtosis and negative skew. I have included below a chart from another article I wrote on April 12, 2020:
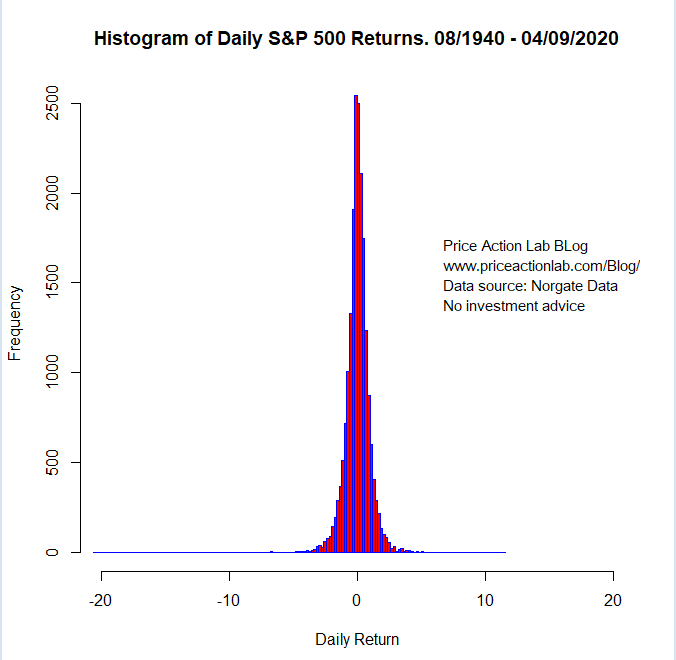
The distribution of daily returns is highly leptokurtic, with a kurtosis of about 24. What does this mean? It means that there are extremely positive and negative outcomes. Traders try to capture the positive outcomes and avoid the negative. But this is not always possible. In reality, finding a strategy that captures positive outcomes while avoiding the negative ones is extremely hard when the objective is to maximize wealth.
Most traders focus on developing strategies but overlook other important aspects of trading, especially the sources of returns. For example, where do the profits come from? No trader can profit from a passive investor simply because they do not sell. Therefore, the profits must come from other market participants who attempt to time the markets. Who are these other market participants? They are the other traders who are also trying to maximize their wealth. This has severe ramifications for trading.
Generating wealth above what a passive market can offer (beta = 1) requires outsmarting other traders, being better with execution, and having strategies with an edge. Every trader believes they meet these criteria. The result is a high level of noise in price action, and luck becomes another factor that determines profitability.
Trying to make more than the market can offer, whether trading stocks, options, futures, ETFs, etc., is extremely hard. Investors who aim at preserving wealth impose restrictions on traders who are trying to maximize wealth. Only a small fraction of aspiring traders will ever become rich; the rest will never make it. The highly leptokurtic distributions of faster timeframes do not provide high odds of profitability.
Premium Content
No hype or gloom-and-doom
Market analysis based on 30 years of skin-in-the-game
By subscribing, you have immediate access to hundreds of articles. Premium Articles subscribers have immediate access to more than two hundred articles, and All in One subscribers have access to all premium articles, books, premium insights, and market signal content.
Specific disclaimer: This report includes charts that may reference price levels determined by technical and/or quantitative analysis. No charts will be updated if market conditions change the price levels or any analysis based on them. All charts in this report are for informational purposes only. See the disclaimer for more information.
Disclaimer: No part of the analysis in this blog constitutes a trade recommendation. The past performance of any trading system or methodology is not necessarily indicative of future results. Read the full disclaimer here.
Charting and backtesting program: Amibroker. Data provider: Norgate Data
If you found this article interesting, you may follow this blog via RSS, Email, or Twitter.


