


This article provides an update on the performance of the PSI5 strategy applied in convergent (mean-reversion) mode to SPY, QQQ ETFs, and Dow 30 stocks. Long-term performance results are also included, from the inception of the ETFs and since 1993 for Dow 30 stocks.
For ETFs, we use all available data since inception, and for Dow 30 stocks, data starting on 01/29/1993, while taking into account delistings available by Norgate Data.
The PSI5 mean-reversion strategy is not data-mined but based on a formula from a text in probability theory that models price action. The strategy is long-only because it takes advantage of the mean-reversion dynamic in price action for timing price action reversals. The strategy can also be used in divergent (trend-following) mode. Click here for more details.
Note that the PSI5 strategy uses only one parameter for the lookback period, which remains the same for all backtests and updates we provide. A rank function with one parameter is used when applying the strategy to index stocks.
Summary of performance as of 12/29/2023
| Market(s) | Start Date | CAGR | Max. DD | Sharpe | 2023 |
| SPY ETF | 01/29/1993 | 9.4% | -22.6% | 0.66 | 3.6% |
| QQQ ETF | 01/02/1999 | 9.9% | -50.4% | 0.47 | 27.9% |
| SPY AND QQQ ETFs | 01/02/1999 | 8.9% | -34.5% | 0.53 | 16.5% |
| DOW 30 | 01/04/1990 | 11.4% | -38.1% | 0.63 | 15.4% |
Backtest details for SPY, QQQ ETFs
Time frame: Daily (adjusted data)
Strategy type: Long-only, no bear market filters.
Backtest period: Inception to 12/29/2023
Commission per share: $0.01
Position size: Fully invested
Position entry and exit: Open of next bar
Stop-loss: None
SPY ETF performance (backtest)
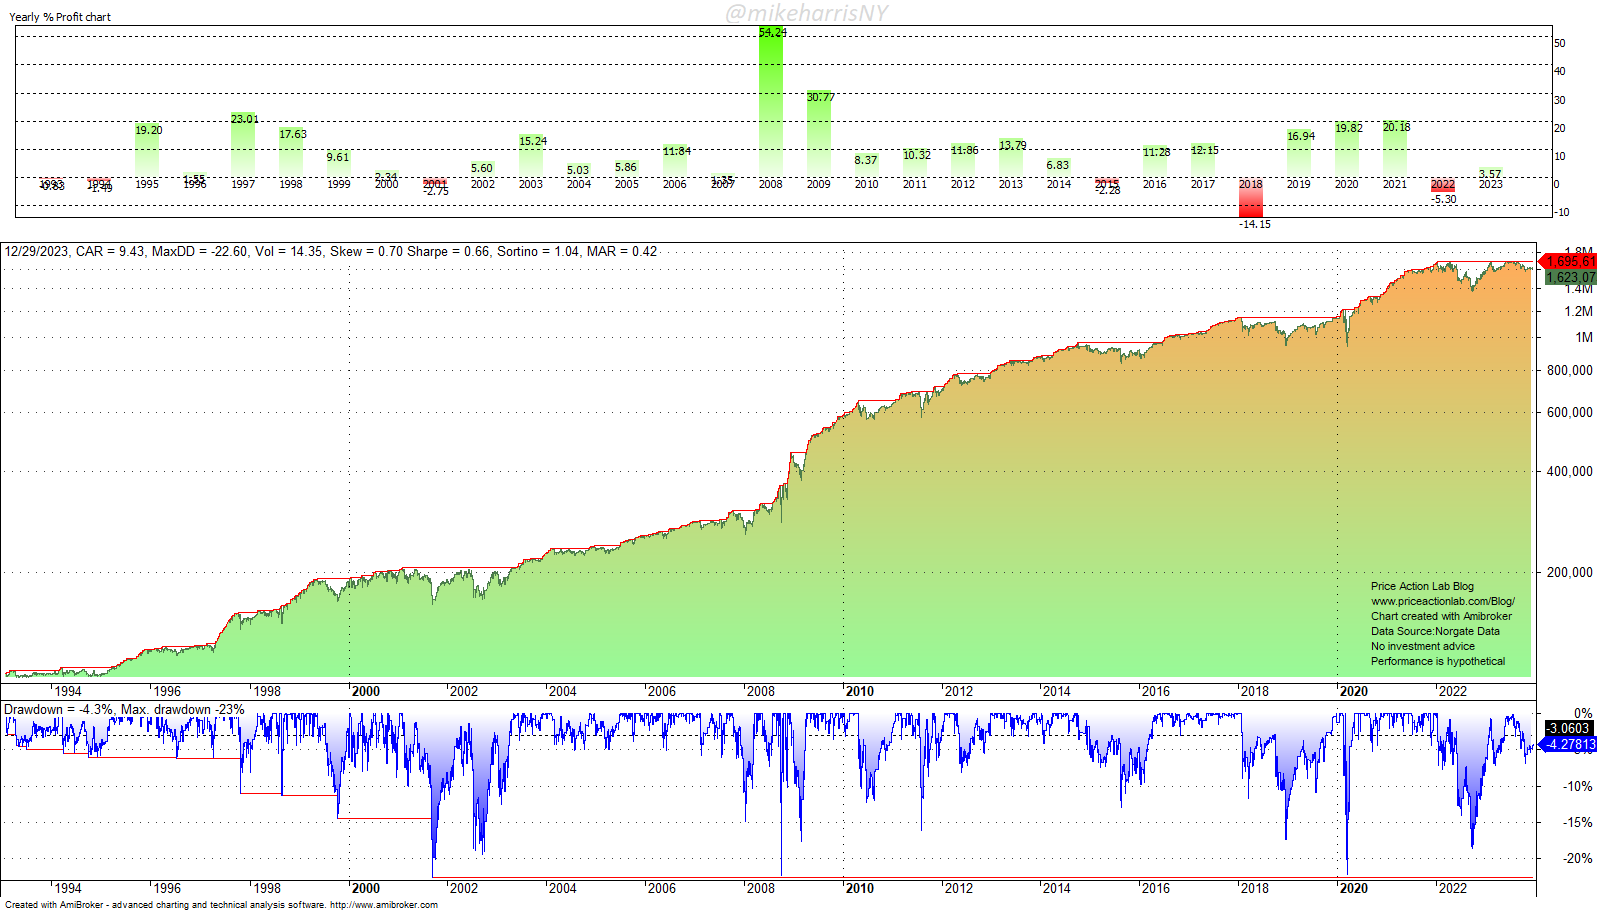
The strategy was up 3.6% in 2023.
QQQ ETF performance (backtest)
Most backtests in blogs with tech stocks and ETFs start after 2003 to avoid showing performance during the dot-com period. In general, if you see a backtest starting after 2003 unless there is a good reason, for example, a lack of data, as is the case with some ETFs, it is probably an attempt to hide the dot-com performance.
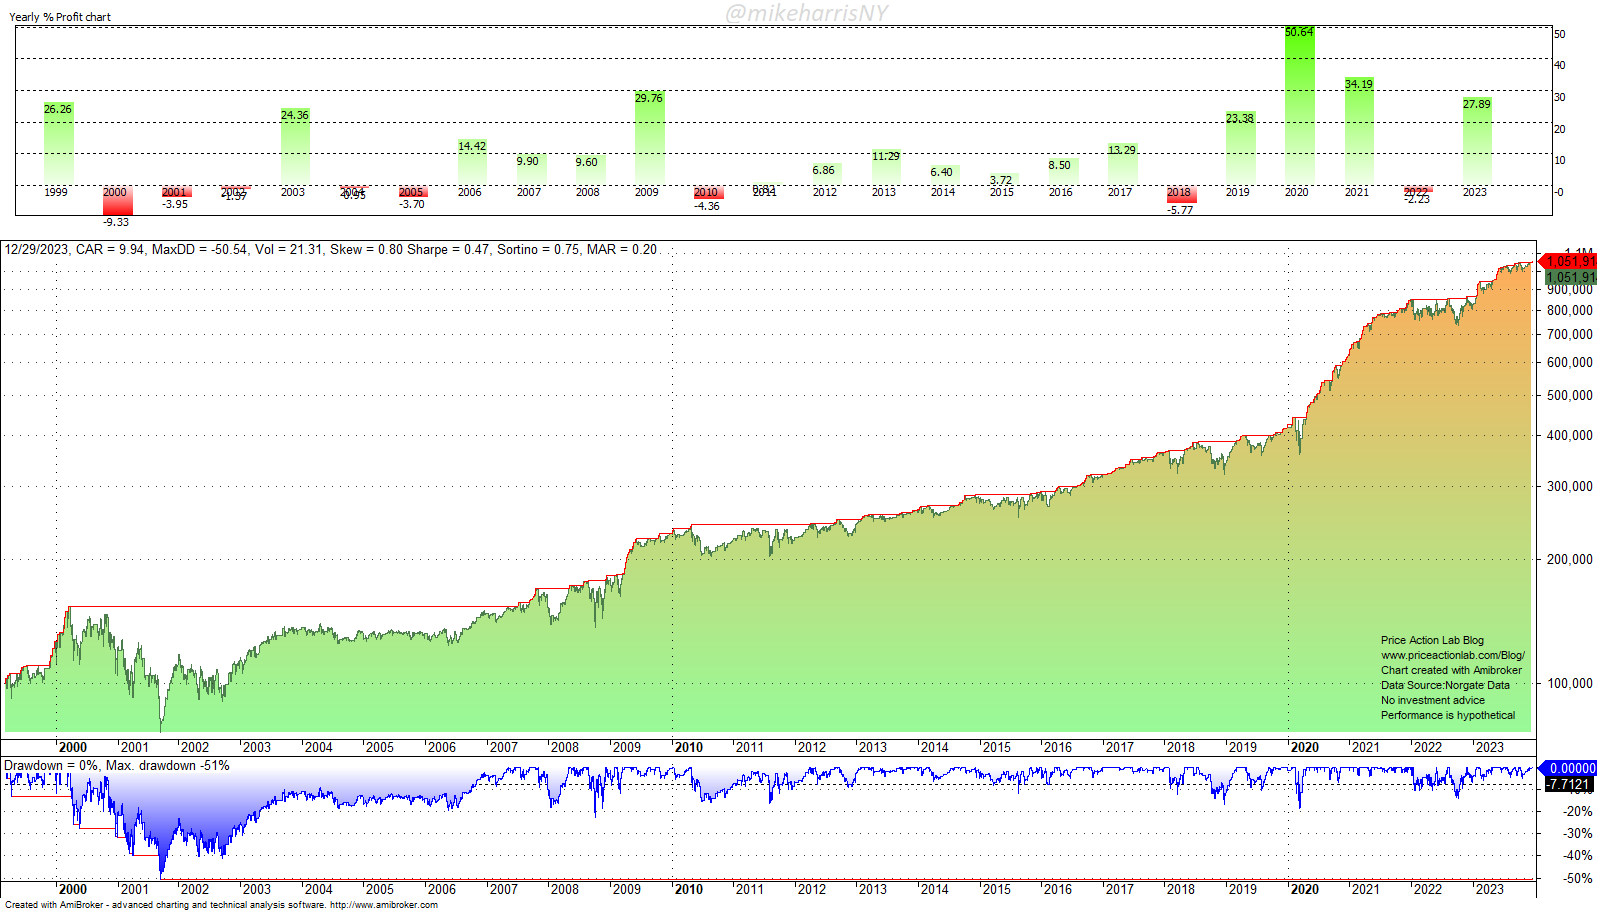
The strategy was up 27.9% in 2023 after a loss of 2.2% in 2022.
SPY and QQQ performance (backtest)
Backtest details
Time frame: Daily (adjusted data)
Markets: SPY and QQQ
Strategy type: Long-only, no bear market filters.
Backtest period: Inception to 12/29/2023
Commission per share: $0.01
Position size: 50% of available equity
Position entry and exit: Open of next bar
Stop-loss: None
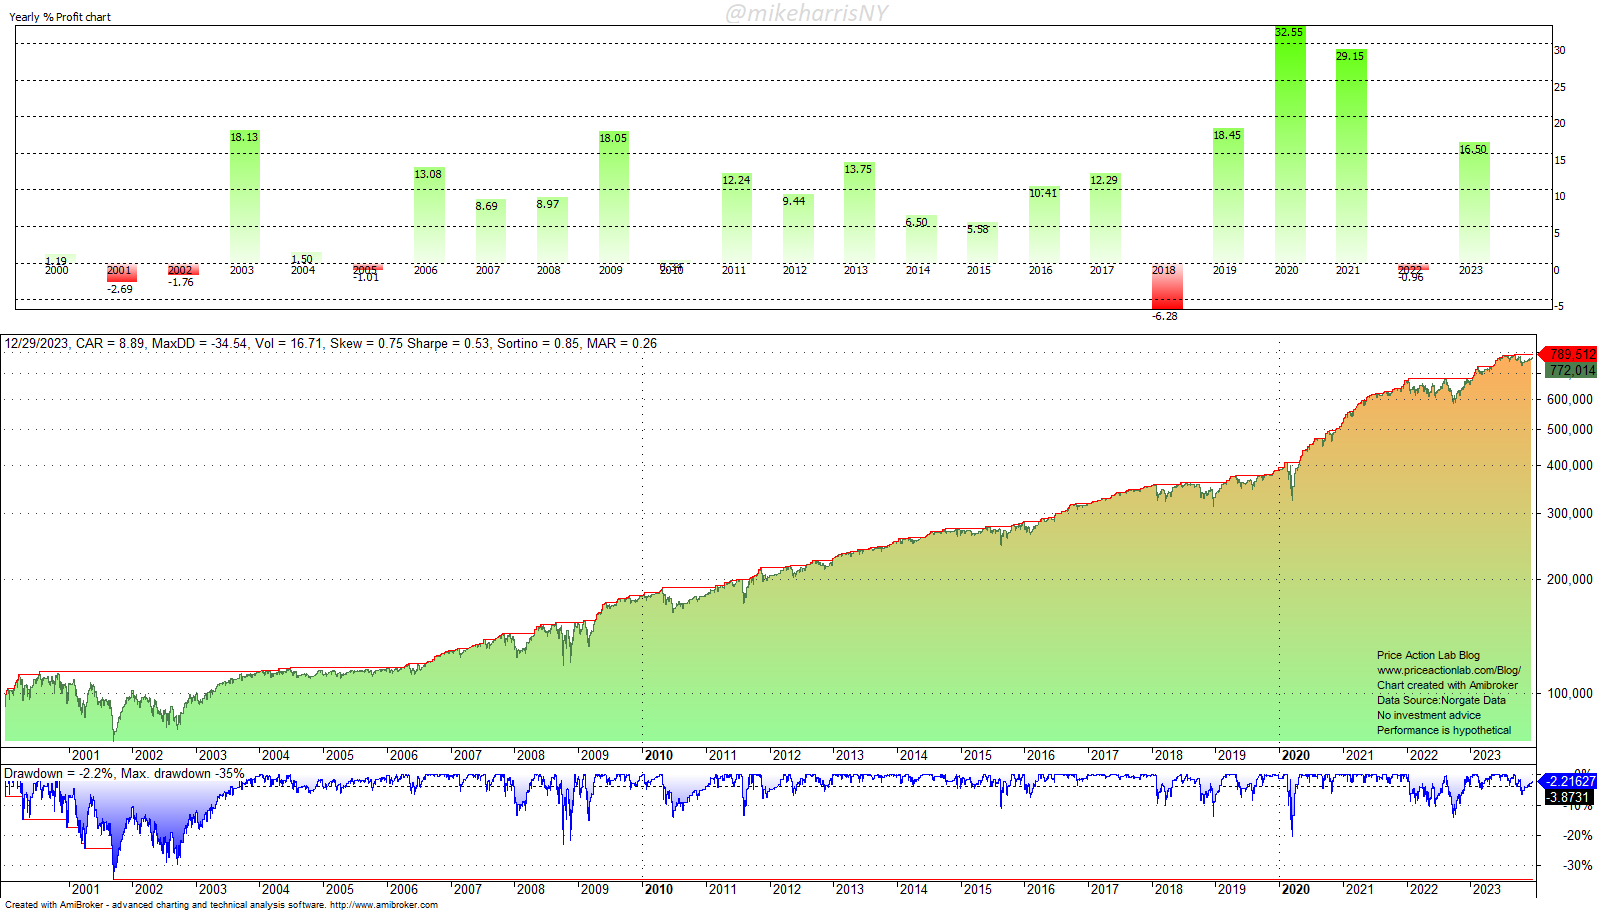
The strategy was up 16.5% in 2023 after losing 1% in 2022.
Backtest details for Dow 30 performance (backtest)
Time frame: Daily (adjusted data)
Strategy type: Mean-reversion, long-only
Bear market filter: None (all signals taken even during corrections)
Universe: Dow 30 stocks (any delistings handled in backtest)
Backtest period: 01/04/1993 to 12/29/2023
Maximum open positions: 10
Rank metric: Lowest rate-of-change in the lookback period
Commission per share: $0.005
Position size per stock: Available equity/10
Trade entry: Open of next bar (no look-ahead bias)
Stop-loss: None
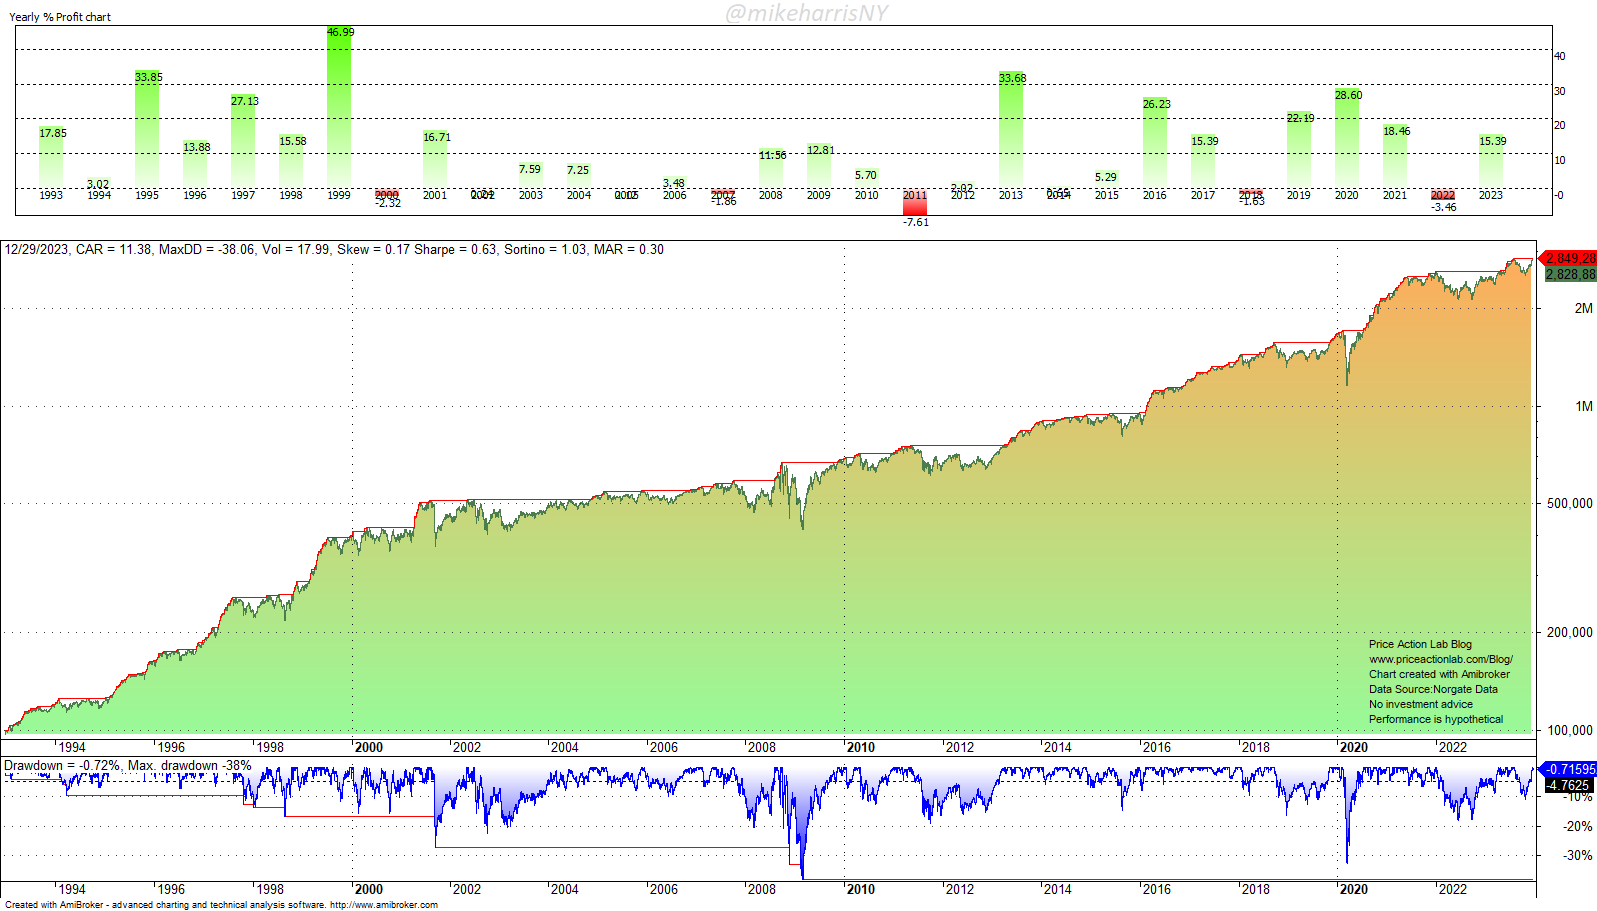
The strategy was up 15.4% in 2023 after a loss of 3.5% in 2022.
FAQ
Why are you selling the PSI5 algo if it is profitable?
Answer: It is rather complicated, and only professionals may understand why.
To start with, profitability depends on execution. If I give the same algo to 20 traders, they will probably generate 20 different equity curves, and the distribution will have a negative skew.
More importantly, traders will take the algo, and some of them may find ingenious ways of improving it. It may end up not being the same algo.
But above all, trading efficiently requires a large amount of capital. If there is no other source of income, then some traders elect to provide training or sell their strategies. The latter is indirectly what hedge funds do without disclosing their strategies. Strick risk management requires large amounts of capital. It takes a long time to compound to the levels needed to make a living, if ever, without an additional income stream.
Finally, mean-reversion became structural after the 1990s, and the edge is not going to disappear any time soon. The real edge is the timing of mean reversion, and the PSI5 algo has its logic for that. In addition, the same algo structure can be used for trend-following.
Click here for a list of strategies.
Contact us below for more information
Disclaimer: No part of the analysis in this blog constitutes a trade recommendation. The past performance of any trading system or methodology is not necessarily indicative of future results. Read the full disclaimer here.
Charting and backtesting program: Amibroker. Data provider: Norgate Data
If you found this article interesting, you may follow this blog via RSS or Email, or on Twitter.


