


We look at the contribution of commodities to the performance of a simple trend-following strategy based on price breakouts. In the last five years, commodities have significantly contributed to trend-following performance. Trend-following makes more sense with commodities.
Trend-following is a simple strategy in principle but challenging in practice.
- The edge primarily depends on execution and discipline.
- Trend-following has a huge optimization space.
Trend-following strategies are simple in principle: the objective is to maximize profits from uptrends or downtrends and minimize losses due to false signals. Success depends on execution and discipline. Trend-followers use a variety of indicators to identify turning points in price action that signal potential trend formations. A stop-loss is usually used to prevent losses from accumulating in the case of false signals. Some trend-followers use dynamic stops, trailing stops, volatility targeting, and even multiple entries and ensembles of strategies. There are no limits to how sophisticated a strategy can get, but the objective is always the same: “Let profits run and cut losses short.”
In this article, we use a basic trend-following strategy that involves one entry rule, one exit rule, and a stop-loss. This is a minimal configuration with a small set of parameters and a small optimization space. The entry and exit rules are based on price breakouts, and the stop-loss is based on volatility at the time of the signal. The stop-loss is also used to determine the position size.
The strategy trades 23 future contracts, 15 commodities, 3 equity indexes, 4 fixed-income, and the US dollar index. Below is the backtest output from 01/03/2000 to 03/12/2023.
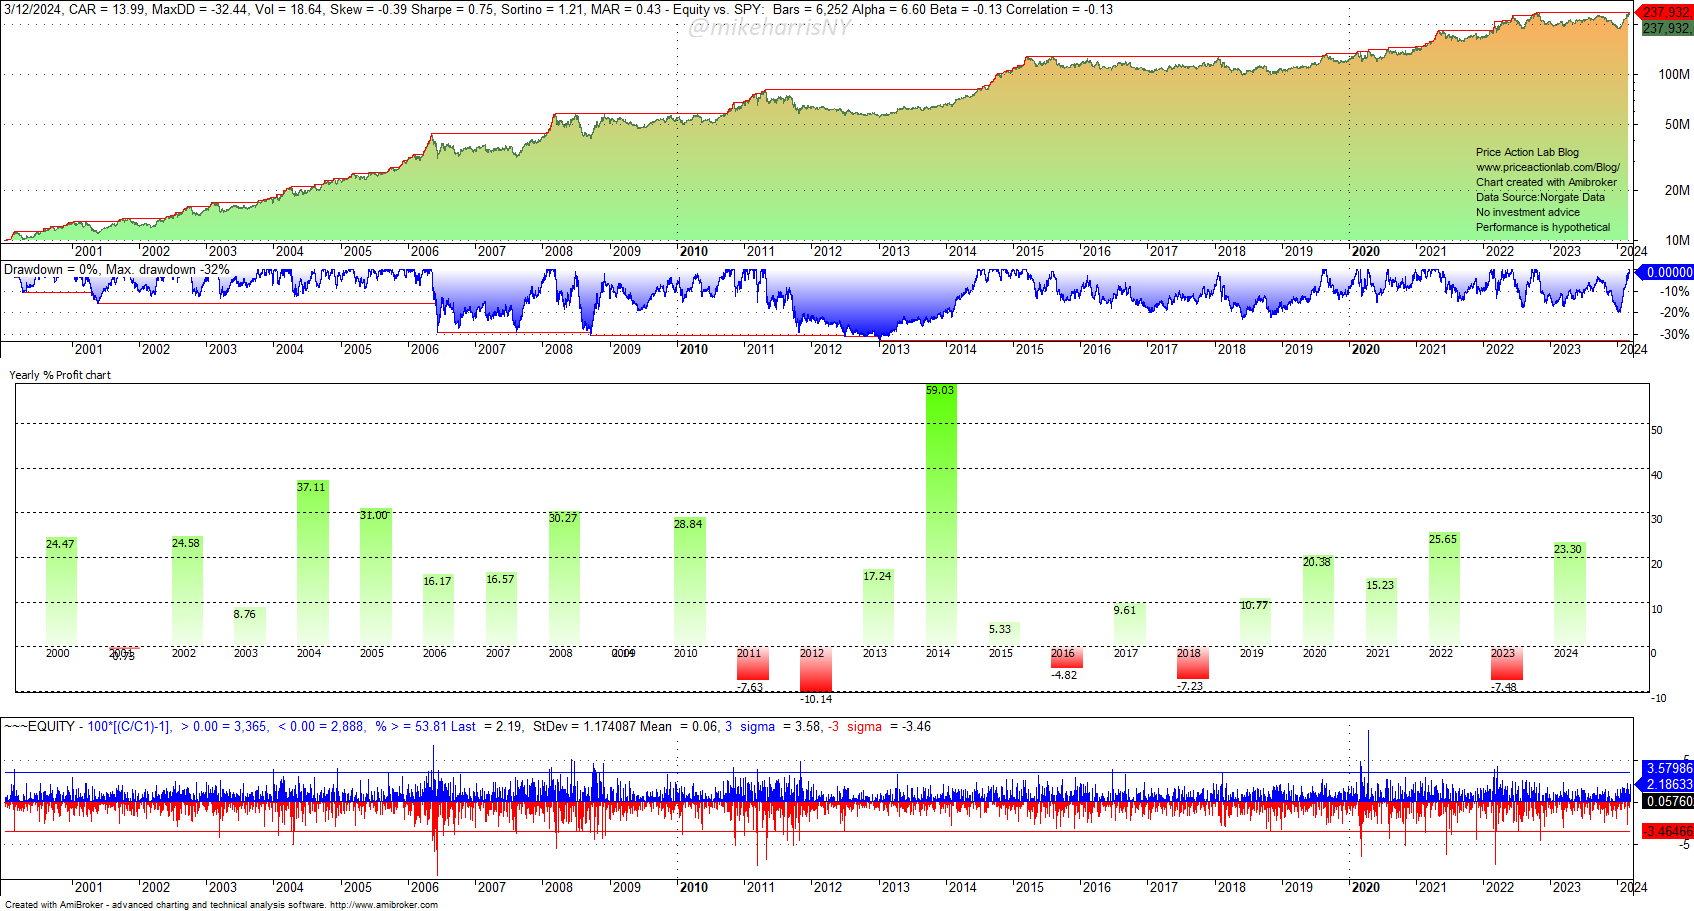
The theoretical (simulated) annualized return is 14%, the maximum drawdown is 32.4%, the Sharpe is 0.75, and the beta is -0.13. This is a simple strategy with plenty of room for improvement, but for this study, we want to keep complexity to a minimum.
Below is the backtest for the same period with the 15 commodity future contracts only.
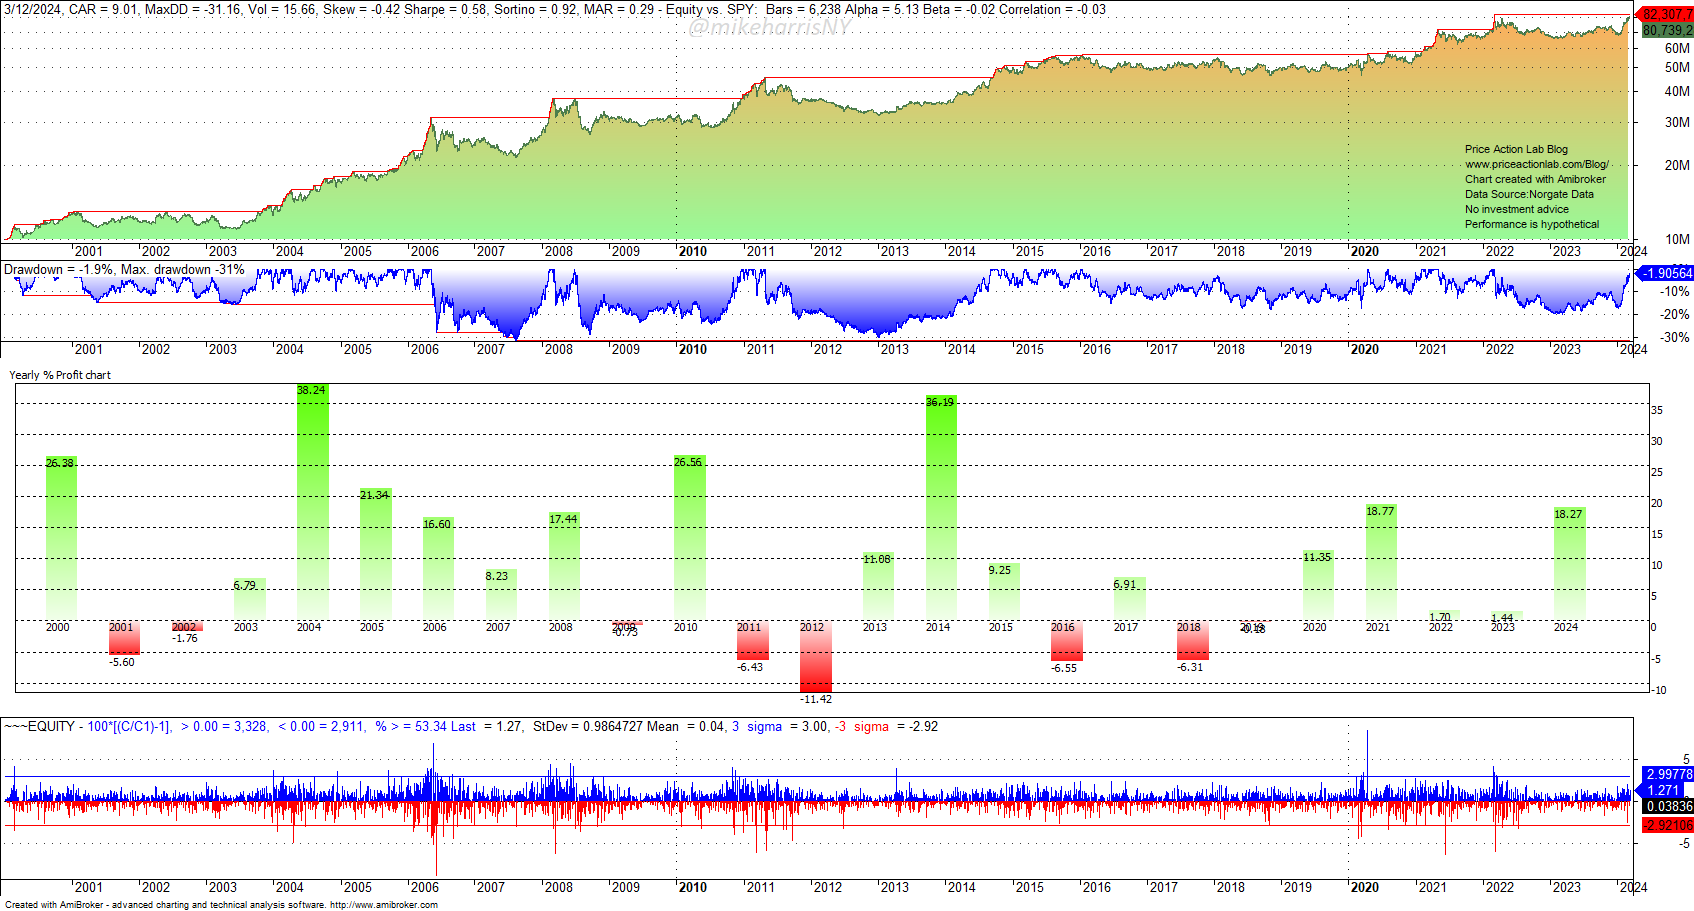
The theoretical (simulated) annualized return is 9%, the maximum drawdown is 31.2%, the Sharpe is 0.58, and the beta is -0.02. Commodities have generated about 64% of the annualized return due to more markets and outliers and a slightly lower beta close to 0, as expected. Below is how the returns in the last five years compare.
| Year | All Futures | Commodities |
| 2020 | 20.4% | 11.4% |
| 2021 | 15.2% | 18.8% |
| 2022 | 25.7% | 1.70% |
| 2023 | -7.5% | 1.4% |
| 2024 (YTD) | 23.3% | 18.7% |
| Total Return | 78.0% | 62.0% |
2020: The contribution of commodities was significant.
2021: Returns were due to commodities.
2022: Commodities had a minimal contribution.
2023: Commodities had the effect of limiting losses.
2024: Commodities have generated most of the profits year-to-date.
The total return from commodities alone is 79% of the total return due to all contracts. Year-to-date, commodities have had a comparable impact as in 2021, due to strong trends in some contracts.
Summary
Overall, commodities tend to boost returns significantly due to developing trends. Trend-following without commodities risks underperformance. This is a risk with trend-following replicators. For example, in 2021, the DBMF ETF returned only 1.8%, a performance that is also compatible with the results of this study due to the ETF not trading any commodity futures. Trend-following makes much more sense with commodities included.
Premium Content
Market analysis based on 30 years of skin-in-the-game
By subscribing, you have immediate access to hundreds of articles. Premium Articles subscribers have immediate access to more than two hundred articles, and All in One subscribers have access to all premium articles, books, premium insights, and market signal content.
Specific disclaimer: This report includes charts that may reference price levels determined by technical and/or quantitative analysis. No charts will be updated if market conditions change the price levels or any analysis based on them. All charts in this report are for informational purposes only. See the disclaimer for more information.
Disclaimer: No part of the analysis in this blog constitutes a trade recommendation. The past performance of any trading system or methodology is not necessarily indicative of future results. Read the full disclaimer here.
Charting and backtesting program: Amibroker. Data provider: Norgate Data
If you found this article interesting, you may follow this blog via RSS, Email, or Twitter.


