


The weekly market reports include a stock market forecast and an analysis of capital markets. Access to the full report requires a Premium Articles, Weekly Premium Articles, or All-in-One subscription.
Included in this weekly market report:
- In search of market truths.
- The one stock rally.
- Is this a bearish signal?
Weekly Summary (March 4–March 8, 2024)
- Stocks fell slightly after mixed signals from economic data.
- Bond yields were lower after dovish comments from the Fed chairman.
- Precious metals rallied, but crude oil prices fell during the week.
- The US dollar fell on expectations of a rate cut in June.
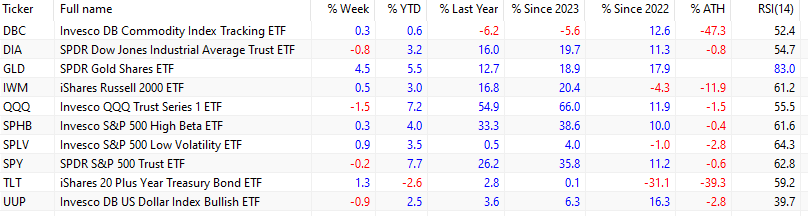
The spot price of crude oil fell 2.43% this week to $78.96 per barrel. Year-to-date, spot crude oil is up 9.8%. The DBC ETF gained 0.3% due to a rally in precious metals. Gold (GLD) surged 4.5%. The U.S. dollar index (UUP) ended the week down 0.9%. After the Fed chairman’s dovish remarks, we could speculate that these actions were a result of worries about inflation rising in a slower-growing economy. If our assessment is correct, then we could see gold rising further and the US dollar falling. Gold has been overbought for five days, and there could be a short-term correction, but the uptrend has gained momentum after a runaway gap this week.
The current move in gold is significant. This precious metal is in its ninth year of an uptrend that started in 2016. Before that, there were two other decade-long bullish regimes, one that started in 1970 and another that started in 2001.
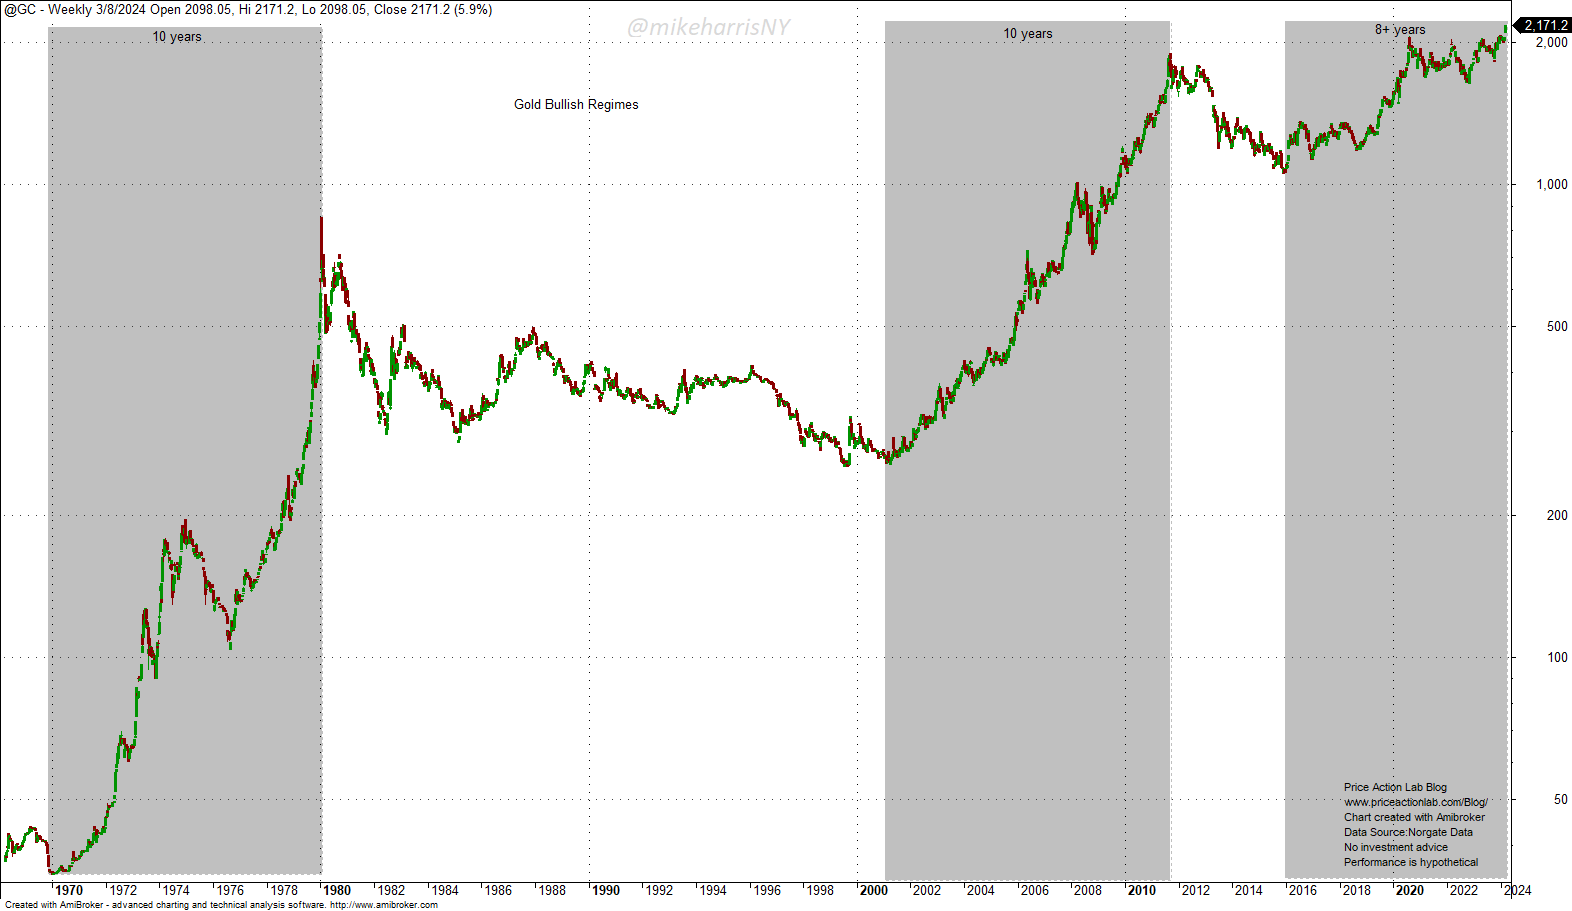
Weekly chart of gold: London PM Fix. Data source: Norgate Data
The above chart shows that previous uptrends in gold have been persistent despite the volatility. The first uptrend was due to abandoning the gold standard and high inflation due to energy crises; the second was due to gold financialization and fear of quantitative easing causing hyperinflation. This regime ended when it became evident that the economists were wrong about hyperinflation. The third regime started with central bank buying and accelerated during the pandemic stock market crash. After an extended consolidation, the gold uptrend resumed late last year, and prices reached new all-time highs.
Fears of persisting inflation coupled with lower growth are likely driving the recent surge in gold. There is also a geopolitical risk driver due to major wars and threats of massive escalation. It is also highly likely that, as in 2011, the current uptrend will end only when the drivers are eliminated. Another possible scenario for ending the gold uptrend is massive sales from central banks, but it has lower odds.
Since 2022, gold has outperformed large caps by a wide margin: the SPY ETF is up 11.2% since 2022, while gold (GLD) is up 17.9%.
Large-cap stocks (SPY) ended the week down 0.2%. Tech stocks (QQQ) fell 1.5%. Small caps (IWM) gained 0.5% but are still down 11.9% from their all-time highs.
High beta large caps (SPHB) were up 0.3%, but low-volatility large caps (SPLV) gained 0.9%, possibly due to risk-off. The Dow Jones Industrial Average (DIA) ended the week down 0.8%. The magnificent 7 equal-weight index fell 2.4% for the week, with AAPL dropping 5% and TSLA plunging 13.5%. Note that despite a massive reversal in NVDA on Friday, March 8, 2024, the stock gained 6.4% for the week and provided a cushion to a deteriorating tech market.
The bond market rallied on Tuesday, March 5, 2024, on weaker-than-expected economic data. The TLT ETF gained 1.3% for the week. Since 2022, the TLT ETF has been down 31.1%. In the same period, large-caps (SPY) have gained 11.2%.
In search of market truths
Many analysts struggle every day to find the truth about markets using technical and fundamental analysis. Will the market uptrend continue, or is there going to be a market top? Will the uptrend in the NVDA continue? Will bitcoin reach $100,000? Will unemployment rise? Is there going to be a recession? These and many other questions are the subjects of articles every day in the financial social media and blogosphere. They all have something in common when it comes to the stock market: they are futile attempts to know some market truths that do not exist yet amid a low signal-to-noise ratio.
When there is either an exogenous event-induced panic or when some significant market participants decide to sell for their reasons, the stock market will decline. There is no way to predict when these will happen. The result of the analysis based on technicals and/or fundamentals is in most cases driven by confirmation bias: bullish analysts will interpret the data in ways that confirm their bullish thesis, and bearish analysts will only look at the bearish aspect of the data.
There are simpler ways to analyze the stock market that do not rely on narratives and long reports. These simpler ways are based on momentum. Simple momentum will stay invested in a market for a better part of a bullish move and also limit losses in bear markets. For example, the popular 12-month moving average model has been long the S&P 500 since April 3, 2023, and the return of the signal for SPY ETF is 26.6%. The maximum adverse excursion of the signal (a technical term for the maximum loss) has been only 1.3%.
Simple momentum seems to work relatively well as compared to complex macroeconomic and technical analysis for stock market positioning. Fancy analysis is not required except in cases where there is a need to construct an asset allocation model that satisfies certain objectives. See this article for more details.
Stock Market Forecast
The forecasting model generates well-defined entry and exit signals for the SPY ETF. The model does not forecast exact tops and bottoms, but the objective is to minimize losses due to large corrections and maximize gains in uptrends. The accuracy has been close to 100% in the last 32 years. Below is the current signal, duration, and strength.
Access the full report with a Premium Articles or All-in-One subscription. By subscribing, you have immediate access to hundreds of articles.
|
This post is for paid subscribers
Already a subscriber? Sign in |
Specific disclaimer: This report includes charts that may reference price levels. The charts may not be updated if market conditions change the price levels or any analysis based on them. All charts in this report are for informational purposes only. See the disclaimer for more information.
Disclaimer: No part of the analysis in this blog constitutes a trade recommendation. The past performance of any trading system or methodology is not necessarily indicative of future results. Read the full disclaimer here.
Charting and backtesting program: Amibroker. Data provider: Norgate Data
If you found this article interesting, you may follow this blog via RSS, Email, or Twitter.


