


Does it make any sense for individual investors and traders to use macroeconomic analysis instead of simple technical indicators? The last two years have raised doubts about the effectiveness of macroeconomic analysis, while simple technical indicators have performed reasonably well.
Macroeconomic analysis is both intriguing and challenging because of the high level of uncertainty, noise, and data lags. The pandemic shock and the distortions of the stimulus programs are still reverberating in macroeconomic variables. For example, despite an inverted yield curve for nearly a year and a half, there has been no recession due to confounders. One problem with macroeconomic analysis is that the sample of past recessions is small, and the confounders are always different. In the present environment, one confounder has been the savings of the consumer. This has invalidated previous relationships between an inverted yield curve and decreasing economic output.
The macroeconomic analysts, investors, and traders who expected a recession missed a good part of the stock market uptrend since October 2022. We now see signs of them turning bullish and shying away from recession claims based on the inverted yield curve.
When there are severe shocks in an economy, as was the case with the pandemic and the policy response, that induces certain instability in the relationships of key economic variables. Some analysts may be successful in navigating this macroeconomic minefield, but for most, it is a difficult exercise.
More importantly, one serious issue with macroeconomic analysis is that a quantitative historical analysis is hard or even impossible. Even if one can build a forecasting model using macroeconomic analysis, it is highly likely that, due to complexity and non-linearities, the confidence intervals will be very wide. However, the macroeconomic analysis space is filled with bold forecasts that rarely include confidence intervals. Some macroeconomic analysts claim the stock market will fall due to a pending recession, and others claim that there will be a soft landing and the bull market will continue. Since everyone knows that the market will eventually go up or down, there is suspicion that macroeconomic analysis forecasts are random. We cannot exclude the possibility that there are consistent winners in that space. There are some good analysts, and by no means does this article intend to claim that all macroeconomic analysis is ineffective. However, proving that success is due to skill and not luck is a daunting task given the complexity of the subject.
For the reasons discussed above, among others, some traders and investors have decided to rely on simple technical indicators that track the momentum of the market. The simplest model is price-series momentum. There are also more advanced models based on cross-sectional asset momentum. But, amazingly enough, so far the simple price series momentum model based on the 12-month moving average has performed well, even after an outlier loss in 2022, as shown below.
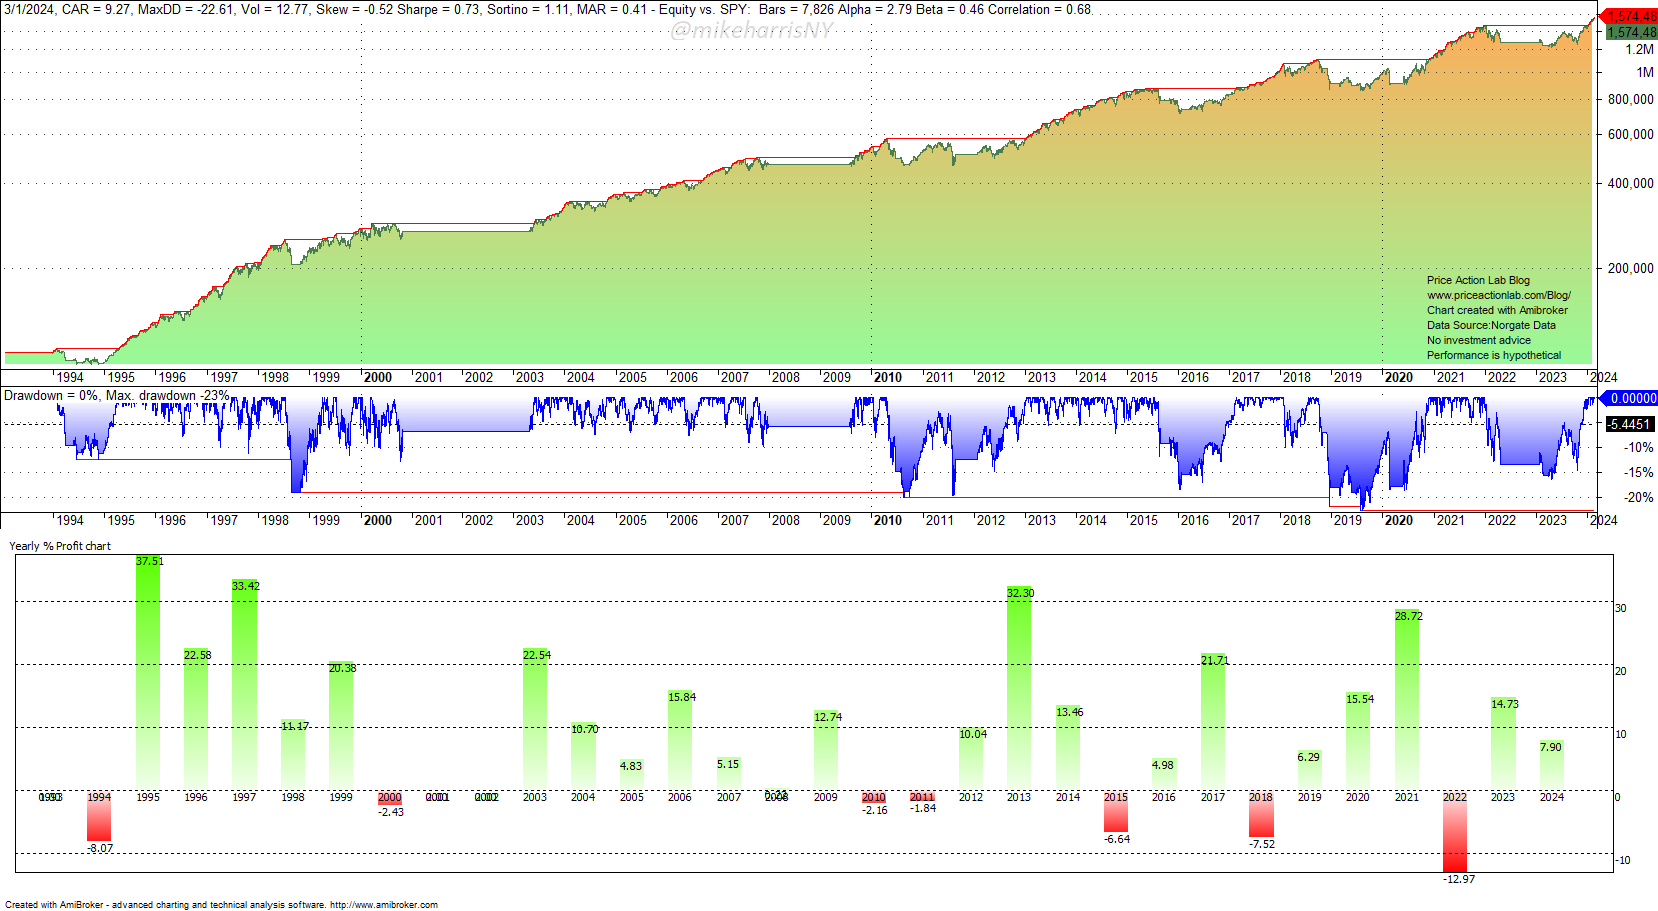
The backtest shows the performance of the simple 12-month price series momentum in the SPY ETF from inception to March 1, 2024: buy when the price is above the average and sell when it is below. Despite an outlier loss of 13% in 2022, the simple strategy has recovered and has made new equity highs. The annualized return is 9.3%, and the maximum drawdown is 22.6%, which is less than half of that of buy and hold. This strategy “pays” about 100 basis points in “protection” to lower beta to about 0.5 and increase the Sharpe ratio to 0.73. The strategy is “dumb” and could suffer losses under specific market conditions, but up to this point, it has performed relatively well.
The key question is: Has macroeconomic analysis matched the performance of this simple model that is agnostic to market conditions but only “tracks” price? Even if it has exceeded expectations, is it worth the effort and time? It is true that macroeconomic analysis is interesting and challenging and provides a sense of understanding of the drivers of the economy and markets, but performance is all that matters.
Finally, some analysts combine both fundamental macroeconomic and technical analysis. This is an interesting area. Part of the approach may have to do with marketing: customers are attracted to ten pages of popular macroeconomic analysis and colorful charts, even if the result is to have the same position as a “dumb” price series momentum strategy. Customers must feel they are paying for unique analysis with an edge. Macroeconomic analysis can offer this feeling, although it may not even be necessary. In other cases, the analysis is interesting on its own merits, especially for those who like to understand economic variables and drivers. Some interesting accounts I follow on social media are unique in this respect.
Premium Content
Market analysis based on 30 years of skin-in-the-game
By subscribing, you have immediate access to hundreds of articles. Premium Articles subscribers have immediate access to more than two hundred articles, and All in One subscribers have access to all premium articles, books, premium insights, and market signal content.
Specific disclaimer: This report includes charts that may reference price levels determined by technical and/or quantitative analysis. No charts will be updated if market conditions change the price levels or any analysis based on them. All charts in this report are for informational purposes only. See the disclaimer for more information.
Disclaimer: No part of the analysis in this blog constitutes a trade recommendation. The past performance of any trading system or methodology is not necessarily indicative of future results. Read the full disclaimer here.
Charting and backtesting program: Amibroker. Data provider: Norgate Data
If you found this article interesting, you may follow this blog via RSS, Email, or Twitter.


