


The weekly market reports include a stock market forecast and an analysis of capital markets. Access to the full report requires a Premium Articles, Weekly Premium Articles, or All-in-One subscription.
Included in this weekly market report:
- The 7 Cs.
- Inflation is rising.
- Hedging weekend tail risks.
Weekly Summary (March 11–March 15, 2024)
- Stocks were down, but performance was mixed.
- Bond yields rebounded after a surprise rise in inflation.
- Crude oil and gasoline prices were up during the week.
- The US dollar rose after a stronger-than-expected CPI release.
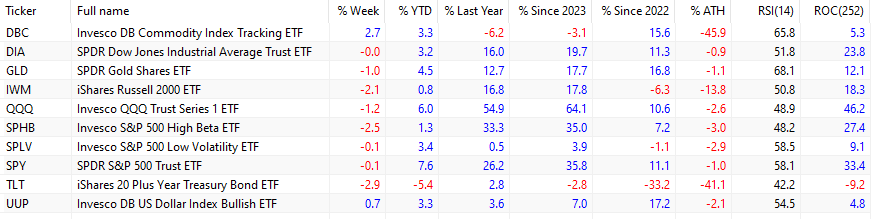
The spot price of crude oil rose 3.8% this week to $81.94 per barrel. Year-to-date, spot crude oil is up 14%. The DBC ETF gained 2.7% due to a high correlation with crude oil. Gold (GLD) fell 1% due to a stronger U.S. dollar index (UUP), which gained 0.7% for the week. Last week, I wrote:
Gold has been overbought for five days, and there could be a short-term correction, but the uptrend has gained momentum after a runaway gap this week.
Despite the correction in gold, since January 3, 2022, the GLD ETF has outperformed the SPY ETF by a wide margin, 16.8% versus 11.1%, respectively.
Large-cap stocks (SPY) ended the week down 0.1%, but tech stocks (QQQ) fell 1.2%. Small caps (IWM) lost 2.1% and are down 13.8% from their all-time highs.
High beta large caps (SPHB) fell 2.5% due to risk-off, but low-volatility large caps (SPLV) were down only 0.1%. The Dow Jones Industrial Average (DIA) ended the week unchanged. The magnificent 7 equal-weight index fell 0.5% for the week. Google (GOOGL) gained 4.3%, while Tesla (TSLA) plunged 6.7% and closed 34.2% below its all-time highs on November 14, 2021.
The bond market had five consecutive losing days this week, with losses accelerating after reports showed consumer and producer inflation was higher than consensus expectations. The TLT ETF fell 2.9% for the week. Since January 3, 2022, the TLT ETF has been down 33.2%, while large-caps (SPY) have gained 11.1%.
The 7 Cs
Watching a Bloomberg Markets interview with Peter Borish was refreshing amid the hype and extremes on financial social media. Peter Borish made references to risk-reward in current markets and to action in the 7 Cs: cocoa, coffee, corn, crude, cotton, copper, and cattle. Below is the year-to-date relative performance chart for continuous, back-adjusted contracts.
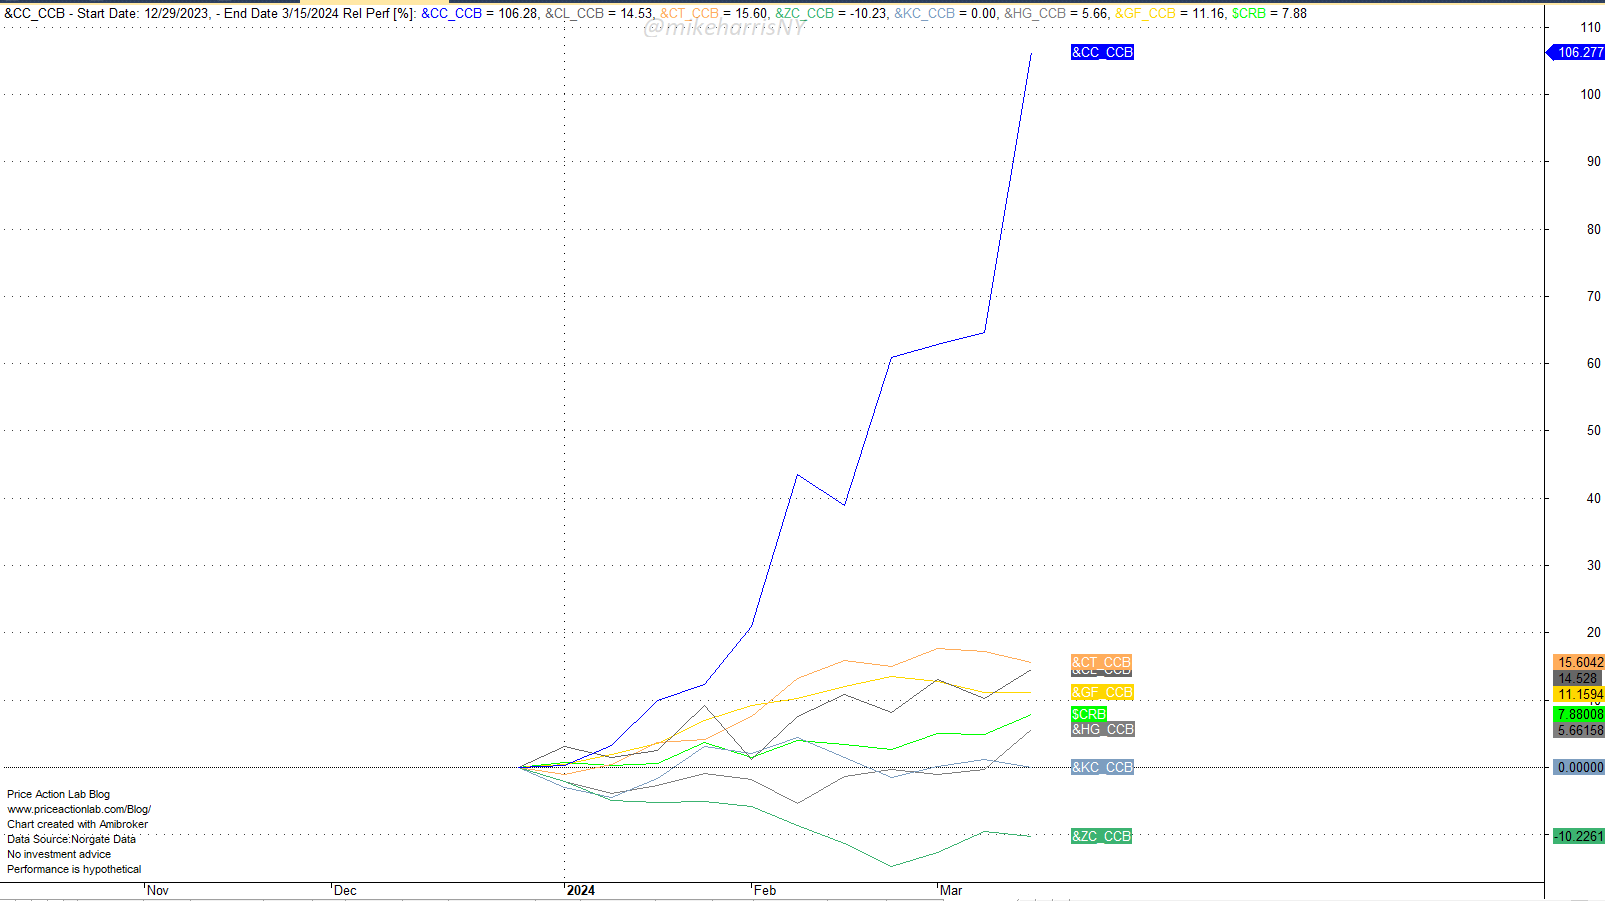
Cocoa is up 106.2% year-to-date due to harvest problems and supply shortages. See this article for more details. Cotton is up 16.5%, crude has gained 14.5%, cattle has risen 11.2%, and copper has added 5.7%. Coffee is unchanged for the year, while only corn is down by 10.2%. The CRB index is up 7.9%, and that is a surprising recovery amid hopes of continuing commodity disinflation.
The rally in cocoa is due to special conditions, but there is always a small probability of spillover to other commodity markets. It is also interesting that copper has started rising this month. Corn may be acting as a headwind to a broad commodities rally. As a result of strong moves in the commodity markets, CTA performance has improved significantly in the last month. Only this week, our proprietary trend-following algorithm, the PSI5TF, with 23 futures contracts, which include 15 commodities, gained 7.3%.
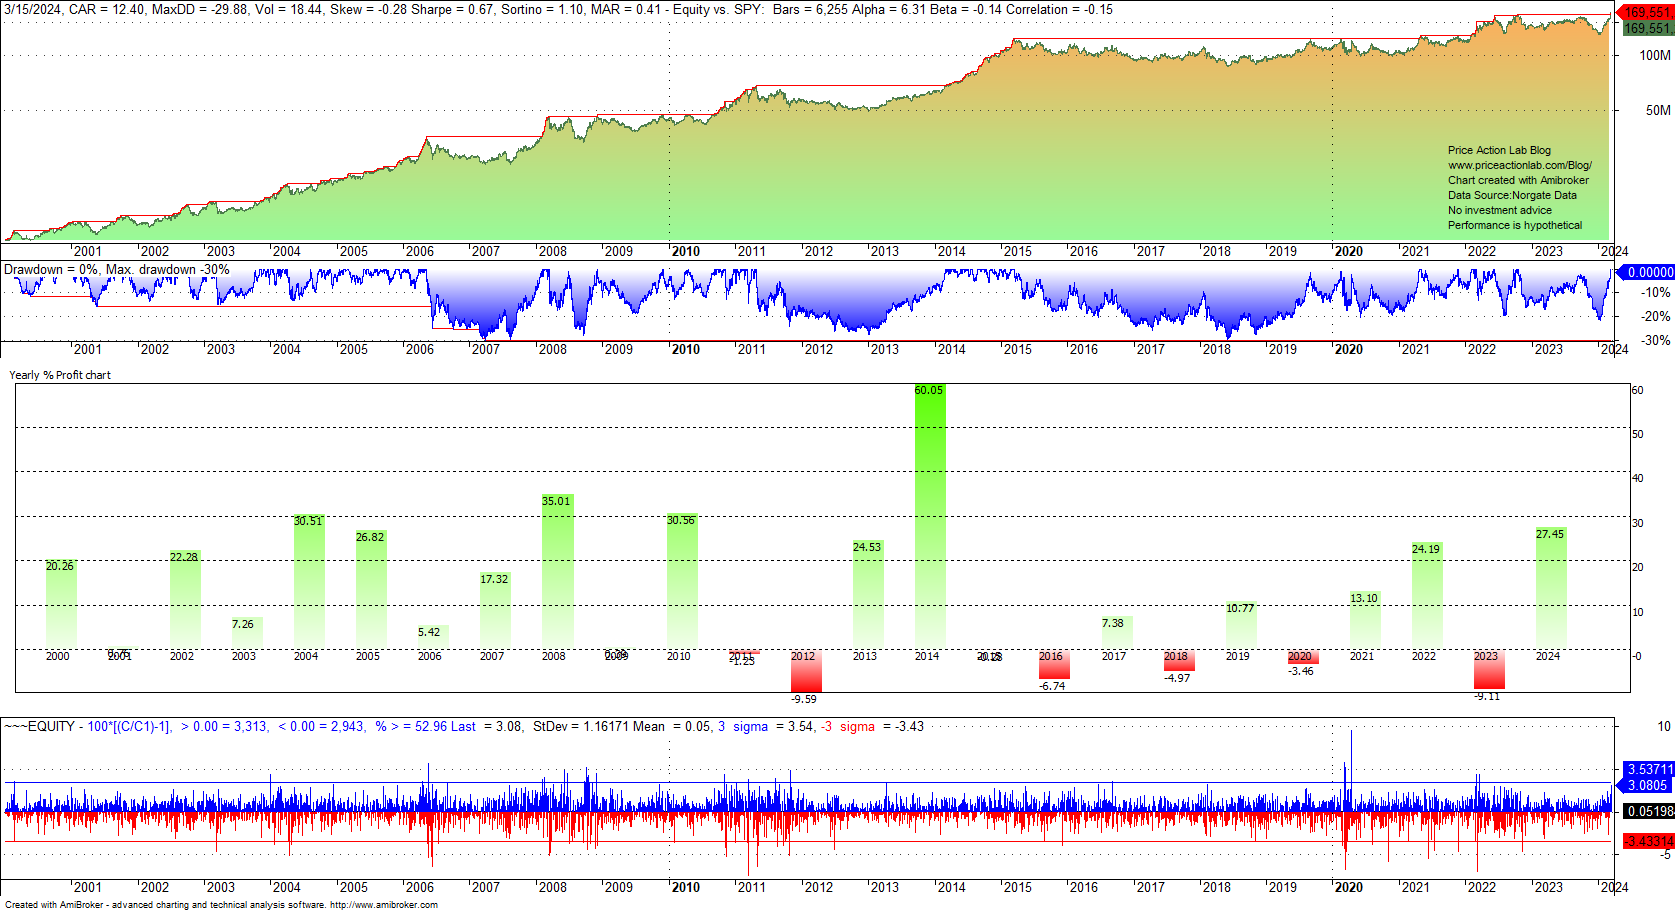
PSI5 Trend-Following Performance Backtest. Price Action Lab Blog
It is surprising that, year-to-date, the performance is higher than in 2022: 27.5% versus 24.2%. This is the best performance since 2014 so far. Is it likely to continue for the rest of the year? In our opinion, this is unlikely, but anything is possible.
Stock Market Forecast
The forecasting model generates well-defined entry and exit signals for the SPY ETF. The model does not forecast exact tops and bottoms, but the objective is to minimize losses due to large corrections and maximize gains in uptrends. The accuracy has been close to 100% in the last 32 years. Below is the current signal, duration, and strength.
Access to the full report requires a Premium Articles, Weekly Premium Articles, or All-in-One subscription.
|
This post is for paid subscribers
Already a subscriber? Sign in |
Specific disclaimer: This report includes charts that may reference price levels. The charts may not be updated if market conditions change the price levels or any analysis based on them. All charts in this report are for informational purposes only. See the disclaimer for more information.
Disclaimer: No part of the analysis in this blog constitutes a trade recommendation. The past performance of any trading system or methodology is not necessarily indicative of future results. Read the full disclaimer here.
Charting and backtesting program: Amibroker. Data provider: Norgate Data
If you found this article interesting, you may follow this blog via RSS, Email, or Twitter.


