


The weekly market reports include a stock market forecast and an analysis of capital markets. Access to the full report requires a Premium Articles, Weekly Premium Articles, and All-in-One subscription.
Included in this weekly market report:
- Underdetermination of theories by data.
- The challenges of strategic allocations.
- Trend-following is back with a strong rebound.
- The battle of the factors and the high stakes.
Weekly Summary (February 26–March 1, 2024)
- Stocks gained as the rally in AI stocks continued.
- Bond yields fell after disappointing sentiment and factory data.
- Commodities gained, and the US dollar was unchanged for the week.
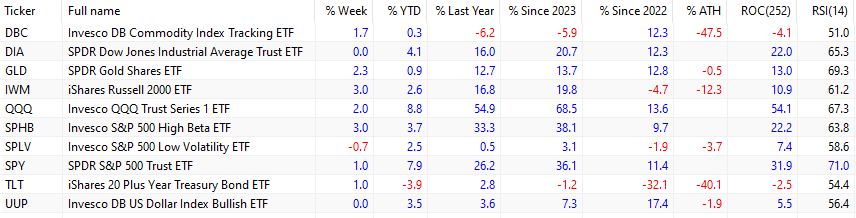
The spot price of crude oil rallied 4.3% this week to $80.9 per barrel as hostilities in the Middle East intensified and OPEC extended output cuts. Year-to-date, spot crude oil is up 12.5%. The DBC ETF gained 1.7% due to rallying crude oil prices and broad commodity gains. Gold (GLD) rose 2.3%, while the U.S. dollar index (UUP) ended the week unchanged.
Large-cap stocks (SPY) ended the week up 1%. Tech stocks (QQQ) added 2%. Small caps (IWM) staged a rebound to gain 3% for the week but are still down 12.3% from their all-time highs.
High beta large caps (SPHB) jumped 3%, but low-volatility large caps (SPLV) fell 0.7% to reverse the pattern of last week. The Dow Jones Industrial Average (DIA) ended the week unchanged. The magnificent 7 equal-weight index gained 1.5% for the week.
The bond market initially came under pressure but then rallied on Friday, March 1, 2024, after weak consumer sentiment and factory order data. The TLT ETF gained 1% for the week. Since 2022, the TLT ETF has been down 32.1%. In the same period, large-caps (SPY) have gained 11.4%.
Large-cap stocks (SPY), tech stocks (QQQ), high-beta large-caps (SPHB), and the Dow 30 (DIA) finished the week at new, all-time highs. The SPY ETF is overbought.
Data underdetermine theories
From Wikipedia:
In the philosophy of science, underdetermination or the underdetermination of theory by data (sometimes abbreviated UTD) is the idea that evidence available to us at a given time may be insufficient to determine what beliefs we should hold in response to it.
Here is an example from the same source:
For example, if all that was known was that exactly $10 were spent on apples and oranges, and that apples cost $1 and oranges $2, then one would know enough to eliminate some possibilities (e.g., 6 oranges could not have been purchased), but one would not have enough evidence to know which specific combination of apples and oranges were purchased. In this example, one would say that belief in what combination was purchased is underdetermined by the available evidence.
Underdetermination claims that there is no reason to believe in the conclusion of a theory because it is underdetermined by data. When it comes to markets, any analysis based on theories about how the economy functions can lead to conclusions that are underdetermined by the data. This does not mean the conclusions are not correct, but only that we cannot know if they are correct. This is one reason traders believe that “price is king.”
One reason that momentum has been popular among a large group of investors and traders is that it relies only on price and its derivatives, like the rate of change. Momentum traders understand the world is too complex to model with any theories, and the available data underdetermines any theories we come up with. In addition, it is always hard to know whether the conclusions are solely due to analysis or if there is an element of wishful thinking: bullish analysts tend to remain bullish despite the available evidence. At the same time, bearish analysts tend to remain bearish even when prices are in an uptrend.
Simple technical indicators seem to work relatively well as compared to complex macroeconomic analysis. See this article for more details.
Stock Market Forecast
The forecasting model’s accuracy has been close to 100%. The model generates well-defined entry and exit signals for the SPY ETF. The model does not attempt to forecast exact tops and bottoms. The objective is to minimize losses due to large corrections and maximize gains in uptrends.
Access the full report with a Premium Articles or All-in-One subscription. By subscribing, you have immediate access to hundreds of articles.
|
This post is for paid subscribers
Already a subscriber? Sign in |
Specific disclaimer: This report includes charts that may reference price levels. The charts may not be updated if market conditions change the price levels or any analysis based on them. All charts in this report are for informational purposes only. See the disclaimer for more information.
Disclaimer: No part of the analysis in this blog constitutes a trade recommendation. The past performance of any trading system or methodology is not necessarily indicative of future results. Read the full disclaimer here.
Charting and backtesting program: Amibroker. Data provider: Norgate Data
If you found this article interesting, you may follow this blog via RSS, Email, or Twitter.


