


We compare the historical performance of All Seasons strategic allocation and Price Action Lab tactical asset allocation.
The well-known All Seasons strategic allocation makes use of the following ETFs and weights:
| ETF | Weight (%) |
| TLT | 40 |
| VTI | 30 |
| IEF | 15 |
| DBC | 7.5 |
| GLD | 7.5 |
The portfolio is rebalanced annually. Below is the equity curve of the allocation and a comparison to SPY ETF buy and hold from 01/03/2007 to 05/31/2022.
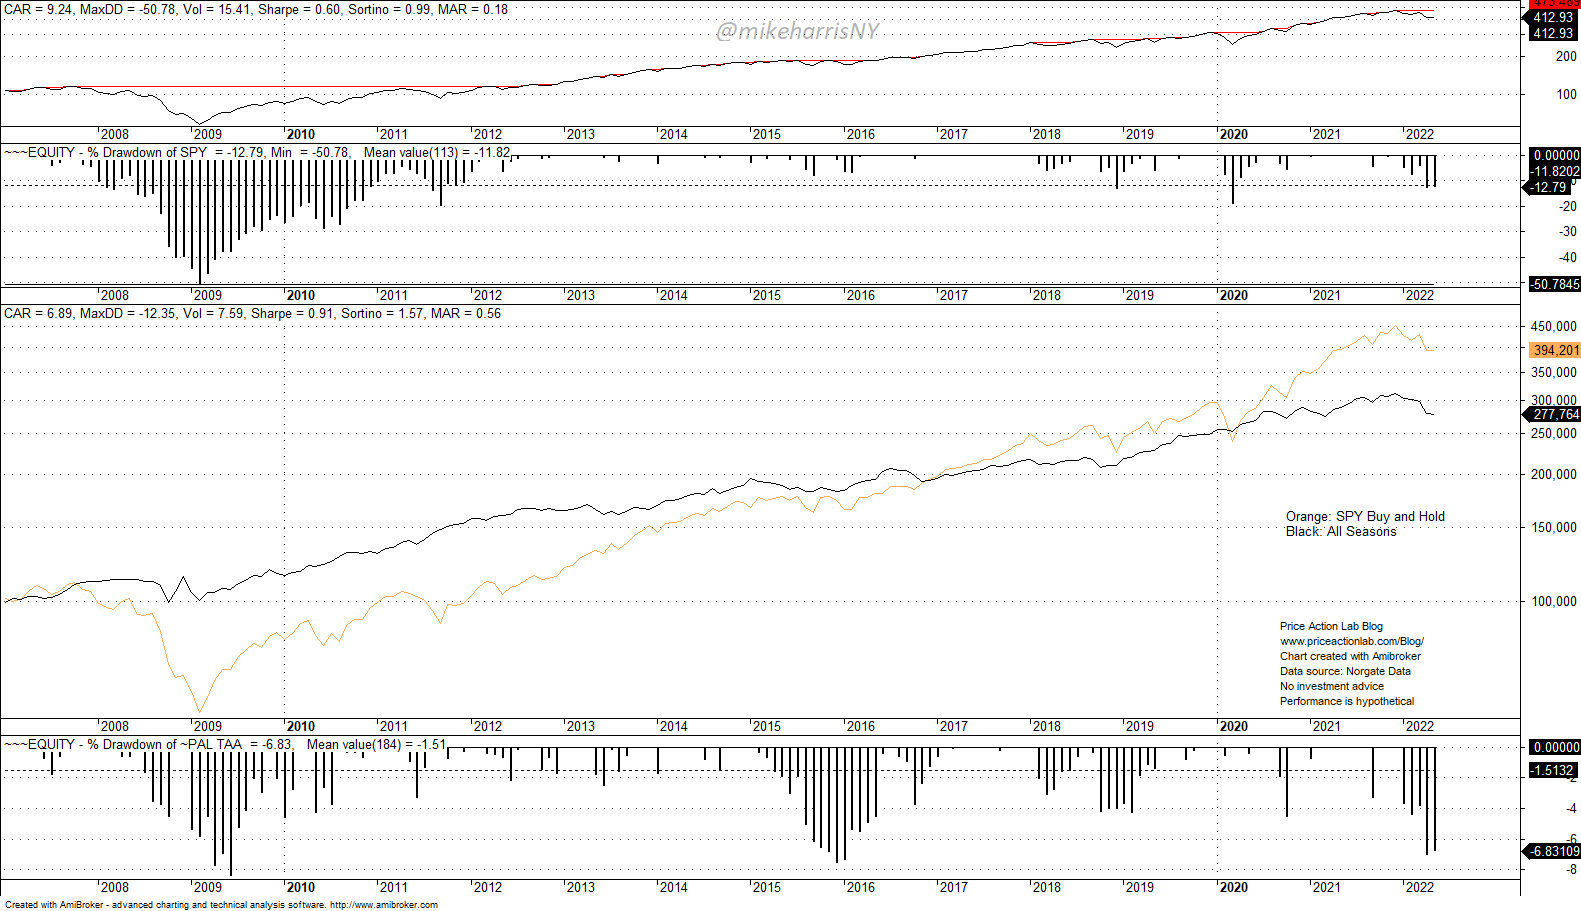
The top two charts show the performance of SPY ETF and its drawdown profile. The third chart shows the equity of the strategic allocation (black line) and buying and holding SPY (orange line). The fourth chart shows the drawdown profile of the allocation.
The All seasons portfolio has outperformed SPY’s total return in the backtest period on a risk-adjusted basis: The Sharpe ratio for the portfolio is 0.91 versus 0.60 for buying and holding SPY.
Below is a chart of yearly returns.
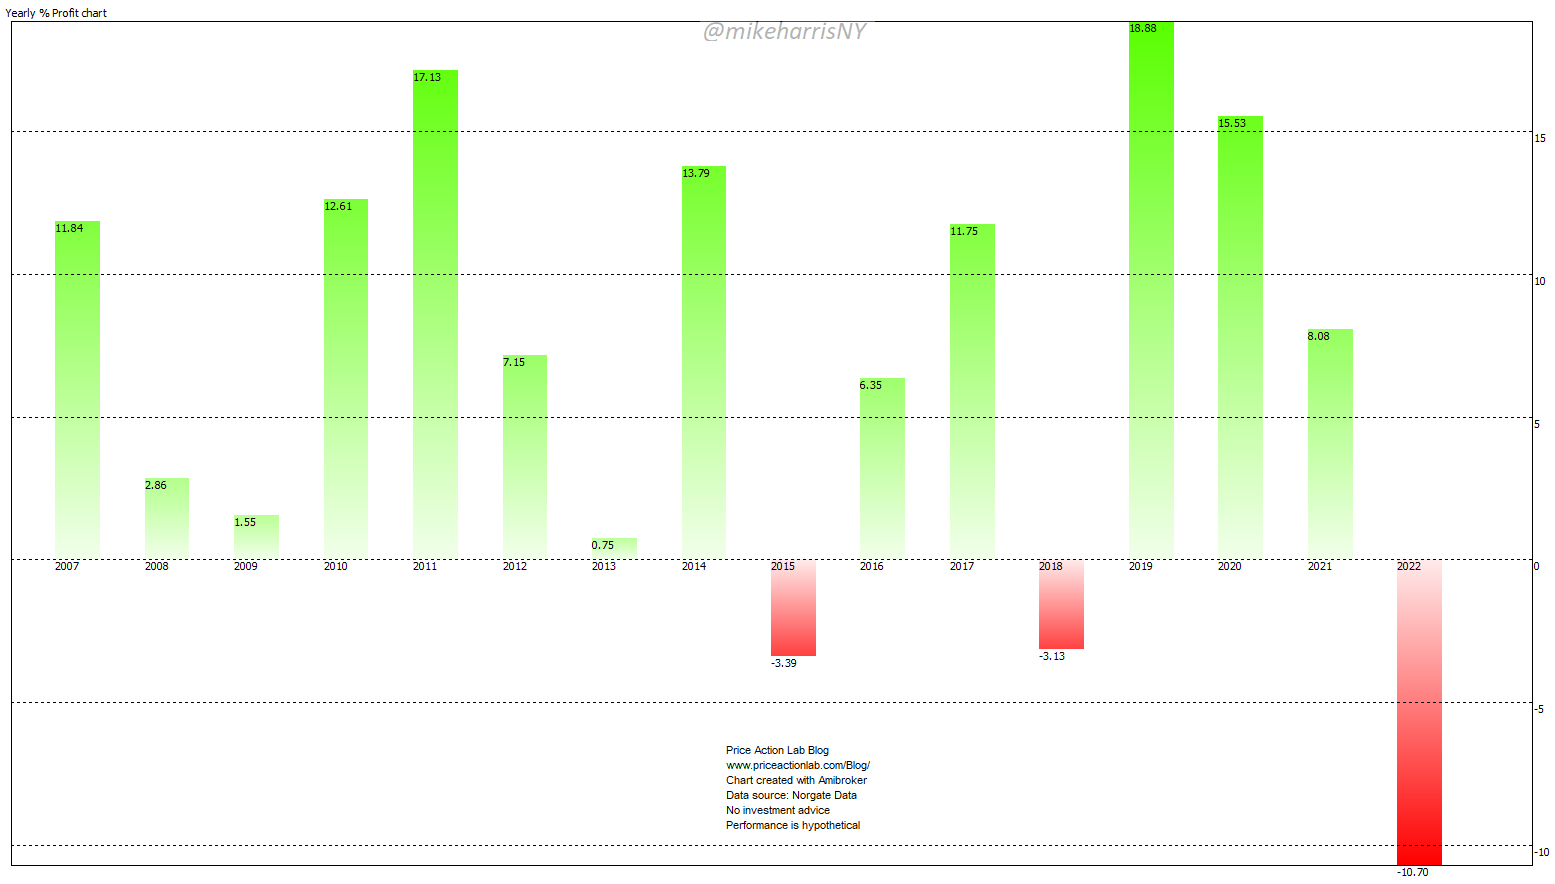
The All seasons portfolio is down 10.7% year-to-date although the worst year was 2015 with -3.4%. This is a sign of a regime change that invalidated the basic premise of this allocation. Specifically, the regime change is due to rising bond yields and falling stocks. Bonds (TLT and IEF) have the largest allocation and that has impacted the performance year-to-date.
Below is a comparison of equity performance of the All Seasons strategic allocation and Price Action Lab Systematic Tactical Asset Allocation (PAL TAA).
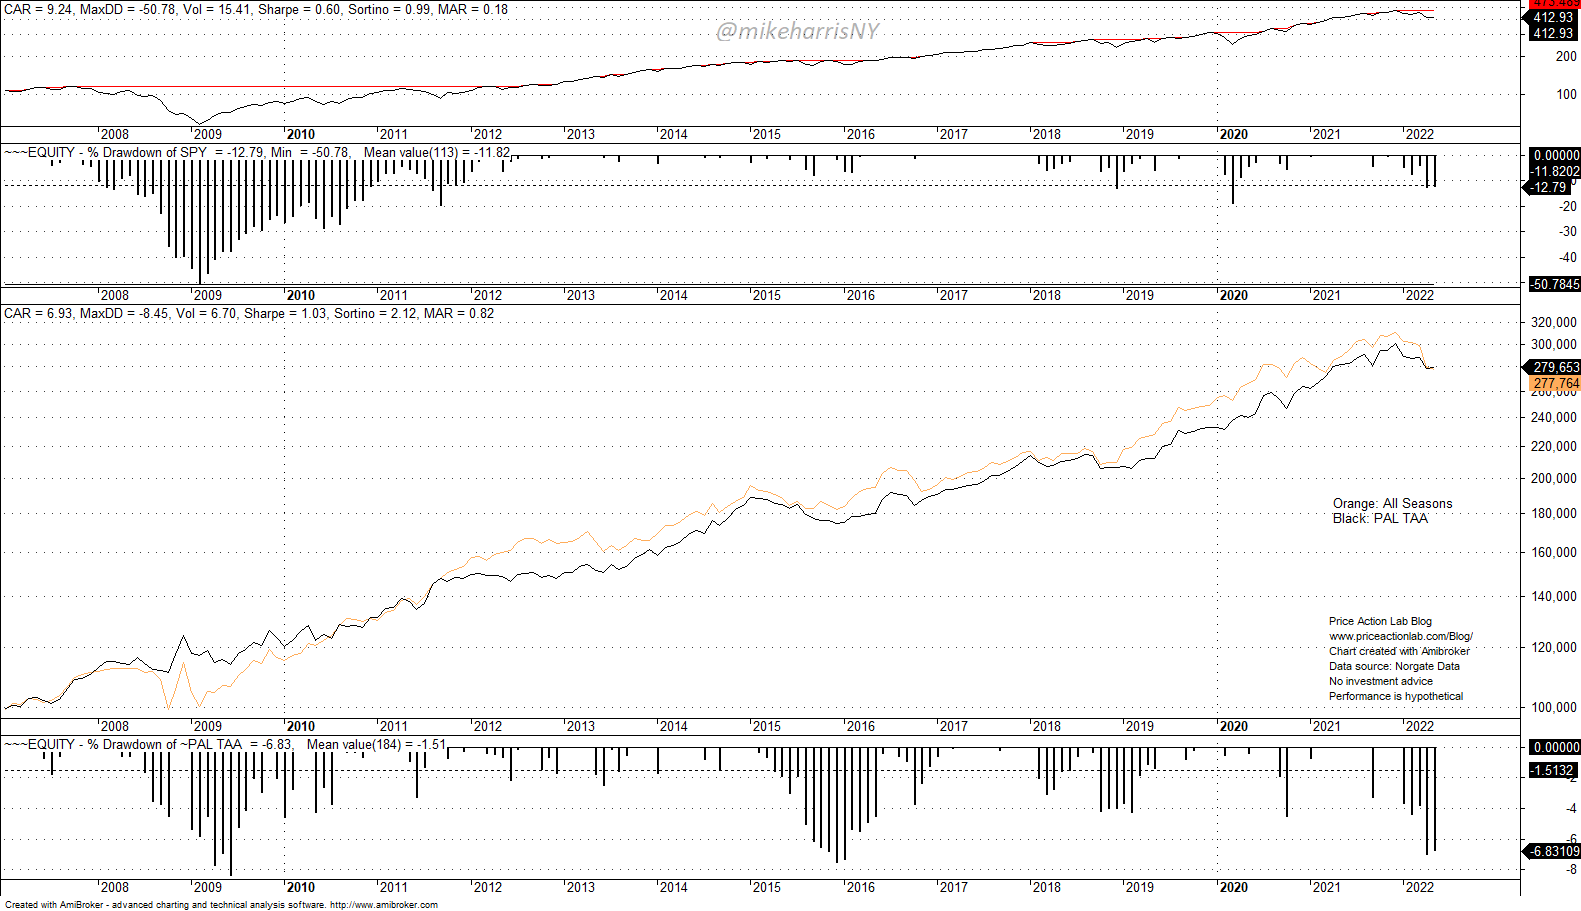
The orange line is the equity of the All Seasons strategic allocation with annual rebalance and the black line is the equity of PAL TAA. The total return is the same over the test period but the volatility and maximum drawdown are lower for PAL TAA. Below is how the two strategies compare.
| All Seasons | PAL TAA | SPY B&H | |
| CAGR | 6.9% | 6.9% | 9.2% |
| Max. DD | -12.4% | -8.5% | -51% |
| Sharpe ratio | 0.90 | 1.00 | 0.60 |
| Volatility | 7.6% | 6.7% | 15.4% |
| MAR (CAGR/Max. DD) | 0.56 | 0.82 | 0.18 |
Although CAGR for the two allocations is the same, for PAL TAA, the max. DD and volatility are lower. This difference results in higher Sharpe and MAR.
PAL TAA uses SPY, TLT, DBC, and GLD. The strategy employs a trend-following algorithm for market timing in the monthly timeframe. If rebalancing is required, this occurs at the start of each month. On the other hand, All Seasons is a strategic allocation with annual rebalancing to maintain the same asset mix.
More details about PAL TAA can be found here. The strategy signals are offered as a free bonus for informational purposes only to Market Signals and All in One subscribers. Subscribers receive an email on the first trading day of each month and before the market opens with the new signals in case there are any.
Premium Content 10% off for blog readers and Twitter followers with coupon NOW10
Disclaimer: No part of the analysis in this blog constitutes a trade recommendation. The past performance of any trading system or methodology is not necessarily indicative of future results. Read the full disclaimer here.
Charting and backtesting program: Amibroker. Data provider: Norgate Data


