

In articles in blogs and in financial and social media, quants identify patterns in some securities that appear profitable or unprofitable. In many cases these attempts reflect a fight against infinite possibilities and insufficient samples but also show lack of understanding of probability and statistics. An example with a pattern in S&P 500 from last three weekly bars is included.
Typical examples of patterns that often appear in articles and posts are listed below:
- Fall of K% from all-time highs
- Inside/outside days
- Consecutive winners/losers
- Short-term reversals (island reversal, key reversal)
- Indicator patterns (RSI, moving averages, MACD, ADX, etc.)
- Rise or fall before some specific holiday
- Add your own pattern here ________________________
All the above patterns have something in common: they arise from a sequence of price bars with each having infinite possibilities.
Yes, you read that right: infinite possibilities. Let us see why below:
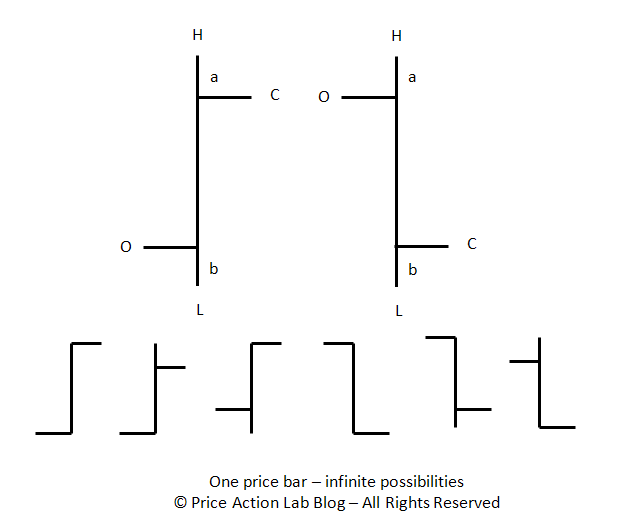
There are two main possibilities in every bar: the close is higher or lower than the open, as shown in the above figure (flat market is a rare vent.). This is only for one price bar.
Then, the distances of the open and close from the high and the low define an infinite variation of price bars, as shown below the main two possibilities, depending on the values of a and b, which are real numbers.
Again, this is only for one bar. Now take two or more bars and you get higher order infinities. In fact, for a two price bar pattern such as an inside day, there are countless possibilities. But we have not even faced the real problems yet.
Yes, there are more and even more serious problems.
The first problem arises from lossy compression. Since there are infinite possibilities, usually quants consider only the close, such as in moving averages, or dismiss the open and close, as in inside and outside days, etc. This results in loss of information and becomes a potential source of data-mining bias.
The second problem arises from lack of sufficient samples. Naive quants often claim that they found a pattern that is 70% profitable. But is a sufficient sample present? Usually there is not because in finance sufficient samples are very large but in typical articles and posts the sample size ranges from 2 to less than 50.
The third problem arises from changes in market conditions that render these patterns unprofitable. There are several examples in this blog of patterns that were highly profitable in the past and suddenly became high unprofitable. An example is price crossing above the 20-day moving average as a buy signal and below the average as a sell signal. That worked exceptionally well in S&P 500 before the 1990s but afterwards failed.
The fourth problem is due to conflating ensemble averages with time domain averages. This shows lack of understanding of probability and statistics. If the relative frequency (win rate) of a pattern is X%, this becomes the probability of success only in the limit of sufficient samples. The expectation assigned to this probability is realized only in the longer-term but in the time-domain averages can cause uncle point. In simper words, if the win rate of the pattern is 70%, there is still 30% probability the next trade will be a loser. Ensemble averages are useful in the longer-term provided they are stationary but not very useful as far as making buy and sell decision for just one trade.
A major conundrum
Many quants relentlessly backtest various possibilities until they come up with some attractive result. This is called data-mining bias. The probability of ruin is very high under this mode of operation.
The probability of ruin cannot be eliminated due to the lossy compression and the other problems mentioned above. But it can be minimized significantly. The way of doing that is the real edge and not the specific patterns used.
The edge usually involves limiting backtesting only to include a certain class of robust indicators determined to be such without any backtesting, limiting the universe to a group of comparable securities so that bias is reduced, performing adequate validation tests and managing risk. This is the list:
- Use robust indicators (features, predictors) that have economic value
- Limit the search domain to a group of comparable securities
- Apply validation tests to maximize power of tests
- Employ risk and money management
How may quants do all of the above? Probably less than 5%.
An example
Let us look at the latest pattern in weekly S&P 500 data:
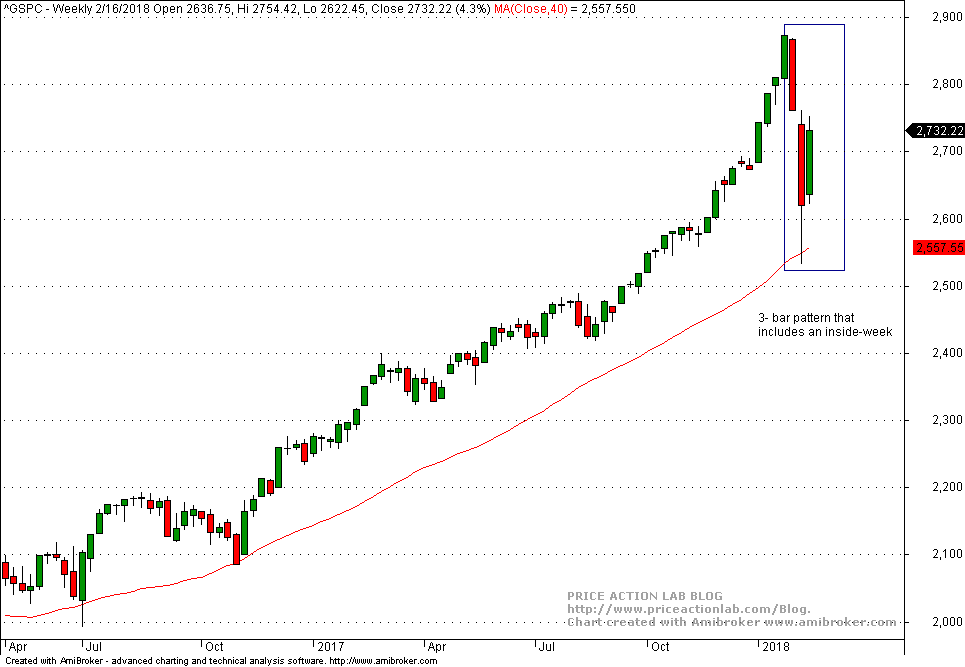
Can we just program the 3-bar pattern shown in the above chart and see if it has been profitable? This is not even remotely possible if there is basic understanding of the problems but as the many articles in financial social media prove there is not any.
In reality there is not one pattern but many patterns. Depending on how we define a pattern, this will result in some number of patterns that we should test. This is not remotely possible to do by hand. I have spent many years working on a theory of price pattern formation based on assumptions that were validated by actual price action. This theory served as the foundation of software I have developed in the past and more recently for DLPAL software. All three versions of DLPAL use the theory but in this example the relevant version is DLPAL DQ, which is a scanner of price bars.
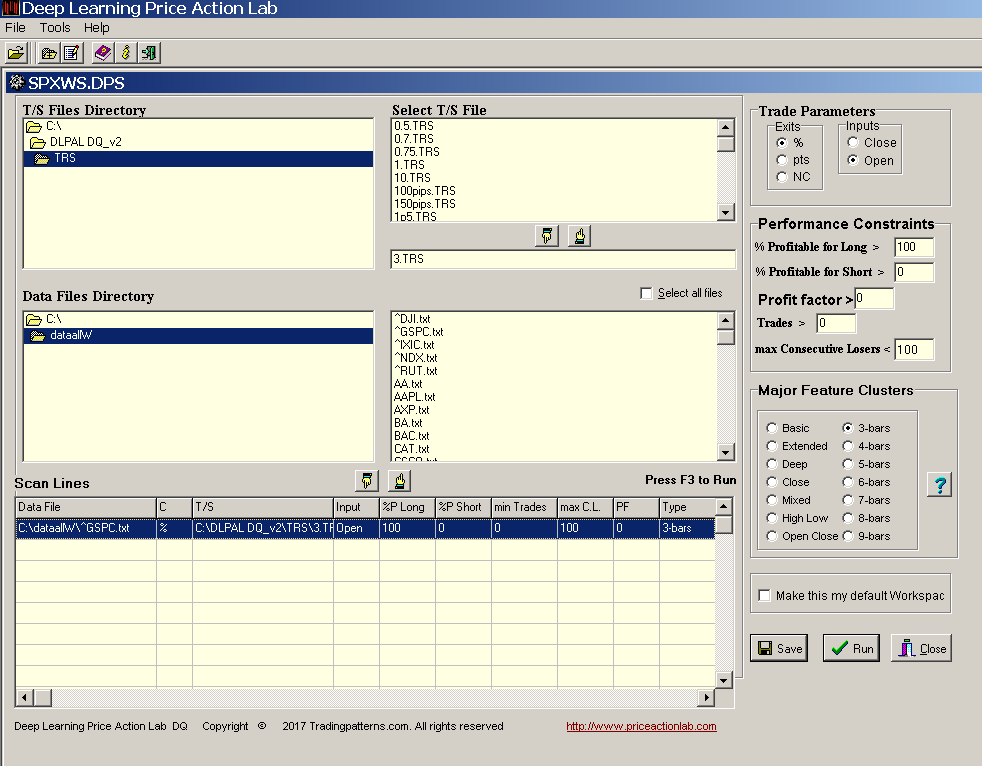
Below is how to set up a workspace to scan weekly S&P 500 data for patterns developed as of the last bar. The patterns considered have maximum length of 9 bars.
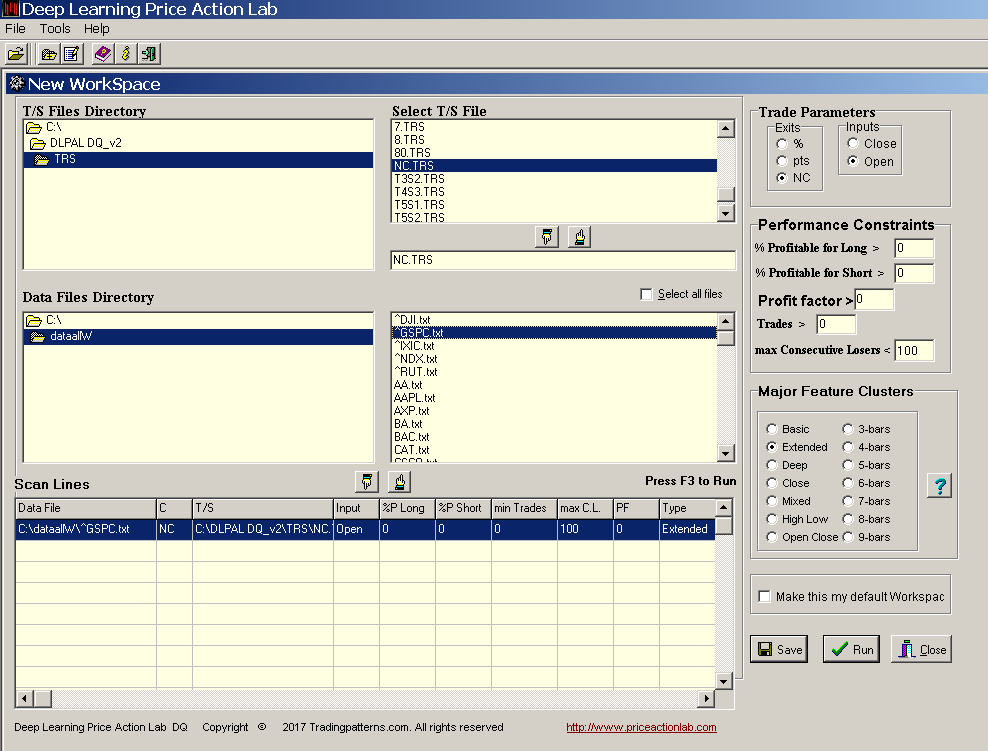
On this workspace I specified next Close exit because I am interested in patterns that generate a profit from the open to the close of the next weekly bar. I have set the win rate of both long and short patterns to zero and this will result in all patterns considered as long the way this program works. Below are the results:
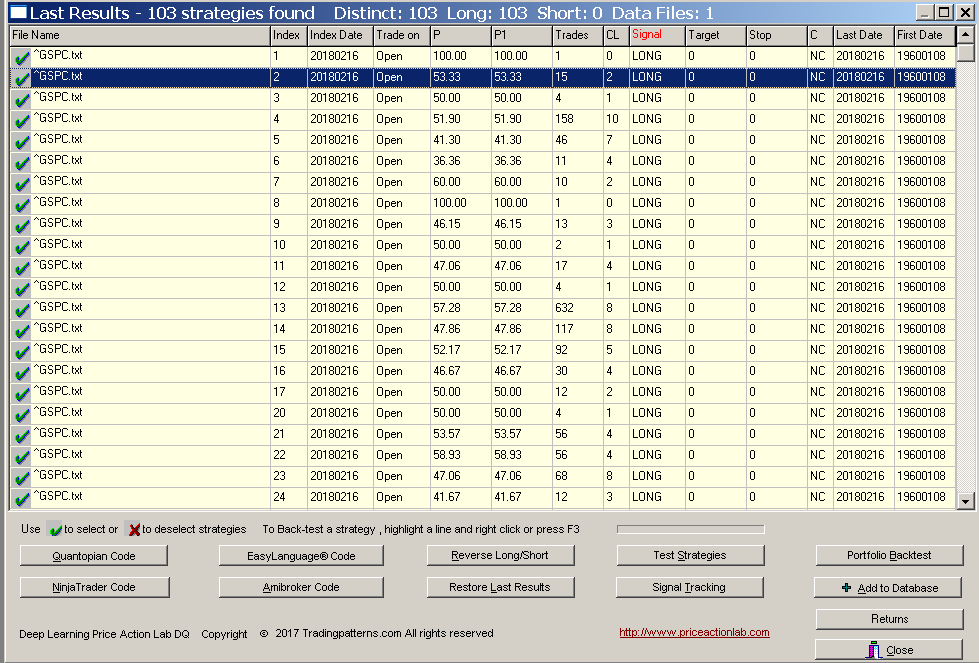
There are 108 strategies (patterns) as of the close of the last weekly bar in the S&P data from 01/1960 to 02/16/2018. Some of the patterns are profitable, most are not. By the way, the 3-bar pattern based on only the highs and the lows of the last three bars is highlighted on the results. There are many other 3-bar patterns that also consider the open and/or the close of the bars.
Next we validate the patterns on weekly data of 30 Dow 30 stocks and 52 popular ETFs and indexes form inception to 02/16/2018. This results in a significant increase in the trade samples of each pattern. DLPAL DQ has a very powerful portfolio backtest function that allows testing results on any number of securities (subject to memory constraints.)

The portfolio backtest results are next sorted for maximum portfolio expectation, Port E. It may be seen that only 10 patterns have positive expectation when tested on the portfolio of securities. There is no evidence of long directional bias from these results.
If we repeat the scan with maximum profitability for long set to 100 so we get only short patterns and then we also repeat the portfolio backtest, then we find out that all but 10 patterns have negative expectation. This means that the directional bias of the last 9 days is to the downside. But this is an ensemble average and cannot be used effectively in trading unless the probability of success is high. This is another level of complexity that must be dealt with. The way I deal with it is by demanding high win rate from patterns and then validating the results. However, the drawback is that this introduces additional lossy compression. But there is no free lunch.
DLPAL allows scanning for patterns consisting of 3 to 9 bars. Below is the workspace for scanning for short 3-bar patterns with 3% profit target and stop-loss in this case.
The results are shown below:

There are 38 patterns (strategies) in the most recent three bars according to DLPAL DQ. Below we repeat the portfolio backtest on 82 comparable securities:
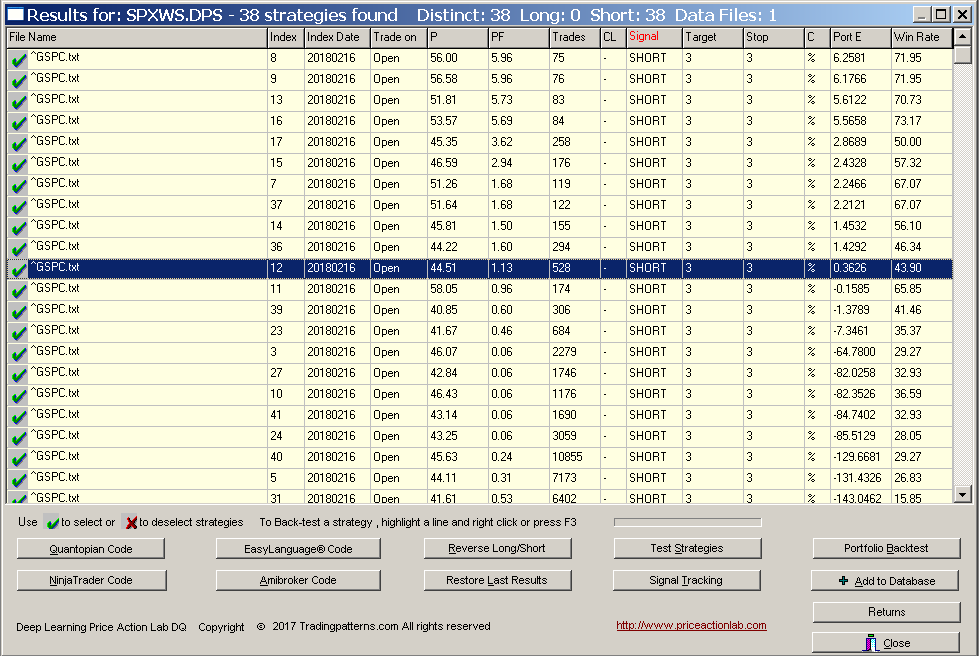
After we sort the results for maximum expectation, Port E, we find out that only 11 strategies have positive expectation. This could mean that 3% profit target and stop-loss do not result in positive expectation for short positions. The same results are obtained for 2% profit target and stop-loss. We conclude that the last three weekly bars can only offer some indication of potential profit for a short position until the close of the next weekly bar only.
A good part of the above analysis can be automated. There is a huge gap between naive backtests and sound quant analysis. In fact, naive quant analysis is not different from random visual charting.
If you found this article interesting, I invite you to follow this blog via any of these methods: RSS or Email, or follow us on Twitter
If you have any questions or comments, happy to connect on Twitter: @mikeharrisNY
Charting and backtesting program: Amibroker
Quantitative analysis of Dow-30 stocks and 30 popular ETFs is included in our Weekly Premium Report. Market signals for longer-term traders are offered by our premium Market Signals service. Mean-reversion signals for short-term SPY traders are provided in our Mean Reversion report.


