


Year-to date performance of a long-short strategy applied to Dow 30 stock universe is nearly 17% net of commissions for a maximum of 12 open positions at any given time. The strategy is based on feature engineering.
The equity long-short strategy described in this article is based on features generated by DLPAL LS software. The features result from identification of price action anomalies in daily stock data. The strategy uses two of the generated features: Pdelta and S, which stand for the directional bias and its significance, respectively.
Examples of how the features are generated by DLPAL LS can be found in this article. Briefly:
DLPAL LS uses primitive attributes of price action to extract features types in an unsupervised learning mode based on general feature clusters. Then, the program uses the extracted features in supervised learning mode to identify long and short candidates in a universe of securities. More…
DLPAL LS generates various types of features for individual but also for groups of securities but the two relevant for the long-short equity strategy in this article are the directional bias Pdelta and its significance S.
Why long-short?
Long-short may provide a hedge in case of market decline depending on dollar neutral state. A good hedge/performance trade-off is achieved when the dollar amount of long positions is equal to that of short positions and preferably also the number of long positions is equal to that of short.
However, dollar neutral strategies usually underperform buy and hold by a wide margin especially during low volatility uptrending markets. Therefore, it may pay to adjust the directional bias of the strategy according to market dynamics. The result of this directional bias may be more long than short stocks, or vice versa, at any given time and different dollar amounts invested in long and short legs as a result.
Strategy
The strategy used to take advantage of market bias is as follows:
Buy/Cover if Pdelta × S > 0
Short/Sell if Pdelta × S < 0
The maximum number of open position is set in advance and if there are ties the rank/score function Pdelta × S is used to resolve them.
Time-frame: Daily (adjusted data)
Strategy type: Long/short equity with bias
Universe: Dow stocks from current composition (DOW not included and DWDP data ended 05/31/2019)
Backtest period: 01/03/2008 – 09/13/2019
History considered for feature calculations: 01/03/2000 – 12/31/2007
Maximum open positions: Fixed in advance between 2 and 30
Position size per stock: Equity/maximum open positions
Minimum holding period: 2 days
Position entry: Open of next bar
Position exit: Open of next bar
Commission: $0.01/share
See also this article for more information.
Performance based on backtests
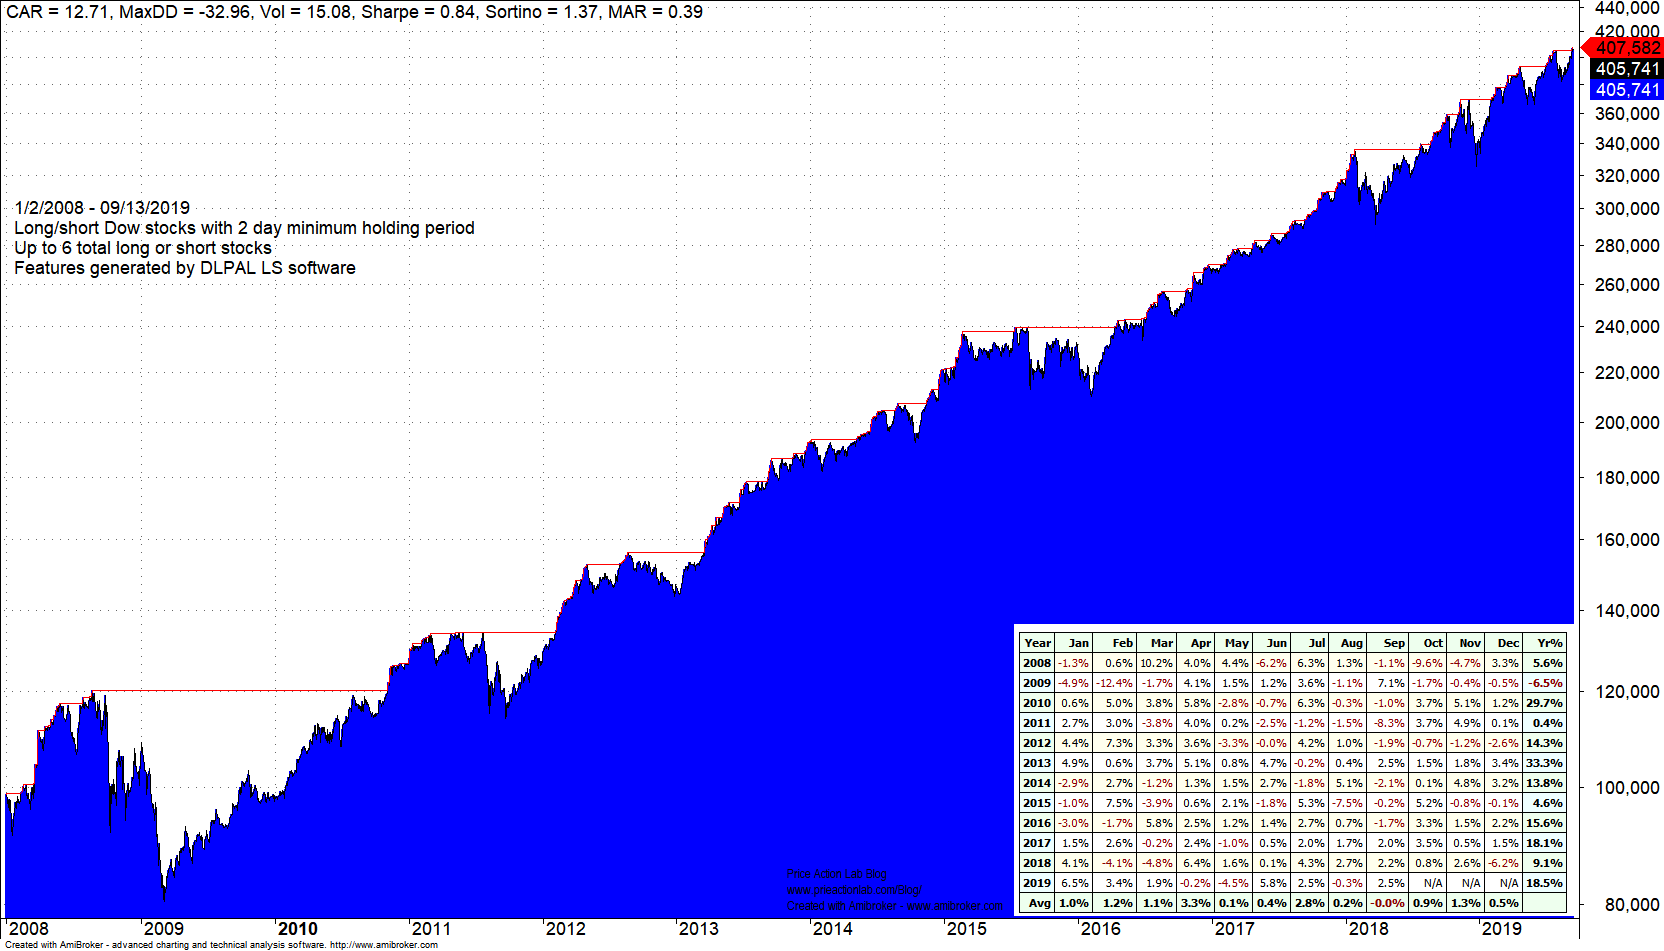
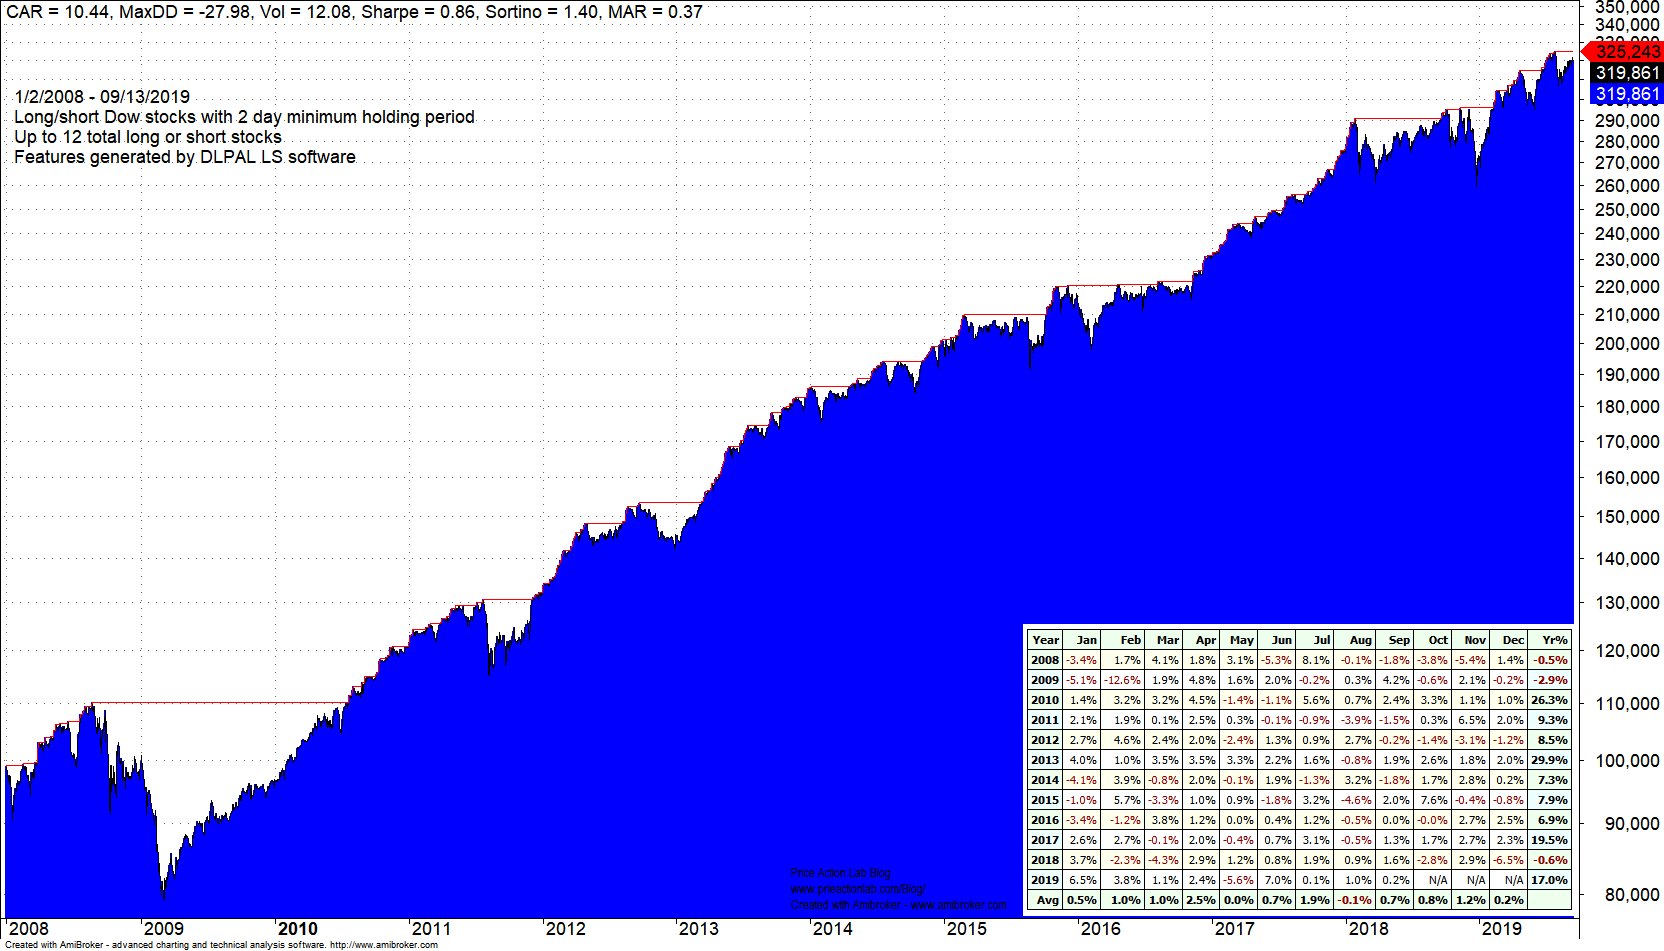
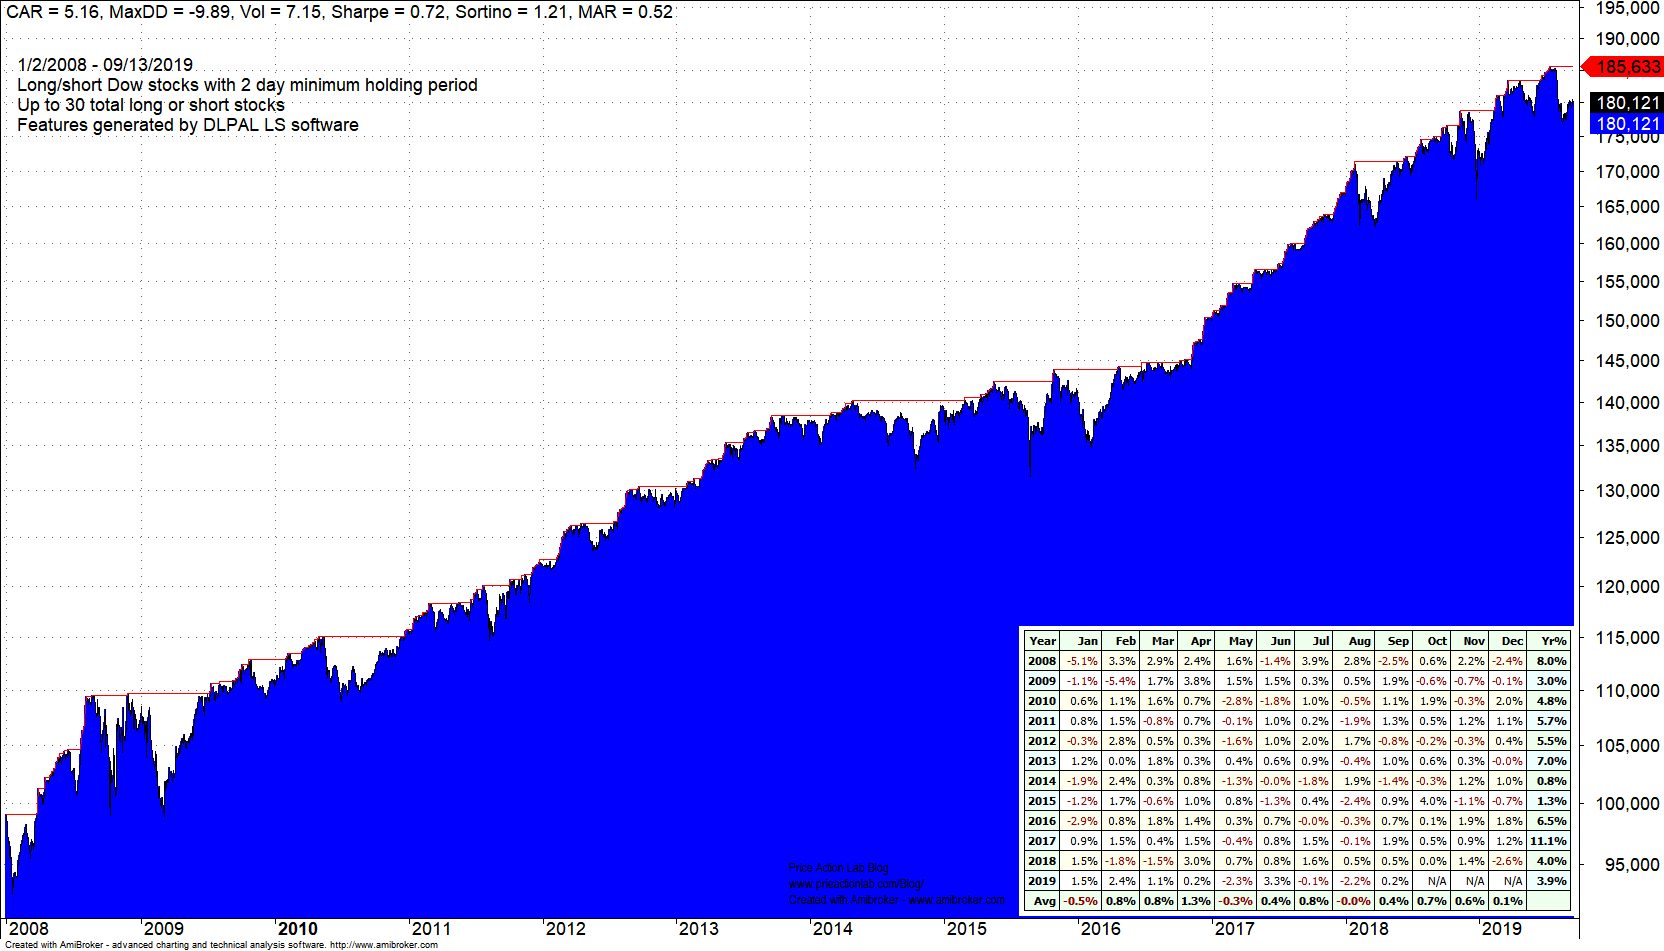
The table below summarizes the strategy performance for maximum number of open positions of 6, 12 and 30.
| Parameter | 6 stocks | 12 stocks | 30 stocks | SPY TR B&H |
| CAGR | 12.7% | 10.4% | 5.2% | 8.6% |
| Max. DD | -33% | -28% | -9.9% | -51.8% |
| Sharpe | 0.84 | 0.86 | 0.72 | 0.43 |
| MAR | 0.39 | 0.37 | 0.52 | 0.16 |
| Trades | 2977 | 6135 | 18038 | 1 |
| Long trades | 2061 | 4101 | 9026 | 1 |
| Short trades | 738 | 2034 | 9012 | – |
| Win rate | 55.2% | 54.5% | 52.1% | – |
| 2008 | 5.6% | -0.5% | 8.0% | -36.2% |
| 2011 | 0.4% | 9.3% | 5.7% | 1.9% |
| 2018 | 9.1% | -0.6% | 4.0% | -4.6% |
| YTD | 18.5% | 17.0% | 4.9% | 21.6% |
Equity curves with monthly returns and performance metrics are provided below but before that some comments:
- As the number of allowed open positions increases, CAGR, max. DD, Sharpe and Win Rate decrease.
- As the number of allowed open positions increases, the ratio of number of long to short trades tends to 1.
- The optimum number for maximum open positions is never known in advance but the trade-offs are known.
Strategy equity for maximum 6 open positions
Strategy for maximum 12 open positions
Strategy for maximum 30 open positions
A different way of developing trading strategies
DLPAL LS offers a different way of developing trading strategies that does not rely on traditional indicators and naive approaches of combining them through random mutations or genetic algorithms. This program is used by fund managers around the world to develop long-short but also directional strategies in a variety of markets.
More details about DLPAL LS can be found here. For more articles about DLPAL LS click here.
If you have any questions or comments, happy to connect on Twitter: @priceactionlab
Strategy performance results are hypothetical. Please read the Disclaimer and Terms and Conditions.


